Moroccan vs French American Indian Disability Age Under 5

COMPARE

Moroccan
Race
Ancestry
AfghanAfricanAlaska NativeAlaskan AthabascanAlbanianAleutAlsatianAmericanApacheArabArapahoArgentineanArmenianAssyrian/Chaldean/SyriacAustralianAustrianBahamianBangladeshiBarbadianBasqueBelgianBelizeanBermudanBhutaneseBlackfeetBolivianBrazilianBritishBritish West IndianBulgarianBurmeseCajunCambodianCanadianCape VerdeanCarpatho RusynCelticCentral AmericanCentral American IndianCherokeeCheyenneChickasawChileanChineseChippewaChoctawColombianColvilleComancheCosta RicanCreeCreekCroatianCrowCubanCypriotCzechCzechoslovakianDanishDelawareDominicanDutchDutch West IndianEastern EuropeanEcuadorianEgyptianEnglishEstonianEthiopianEuropeanFijianFilipinoFinnishFrenchFrench CanadianGermanGerman RussianGhanaianGreekGuamanian/ChamorroGuatemalanGuyaneseHaitianHmongHonduranHopiHoumaHungarianIcelanderIndian (Asian)IndonesianInupiatIranianIraqiIrishIroquoisIsraeliItalianJamaicanJapaneseJordanianKenyanKiowaKoreanLaotianLatvianLebaneseLiberianLithuanianLumbeeLuxembourgerMacedonianMalaysianMalteseMarshalleseMenomineeMexicanMexican American IndianMongolianMoroccanNative HawaiianNavajoNepaleseNew ZealanderNicaraguanNigerianNorthern EuropeanNorwegianOkinawanOsageOttawaPaiutePakistaniPalestinianPanamanianParaguayanPennsylvania GermanPeruvianPimaPolishPortuguesePotawatomiPuebloPuerto RicanPuget Sound SalishRomanianRussianSalvadoranSamoanScandinavianScotch-IrishScottishSeminoleSenegaleseSerbianShoshoneSierra LeoneanSiouxSlavicSlovakSloveneSomaliSouth AfricanSouth AmericanSouth American IndianSoviet UnionSpaniardSpanishSpanish AmericanSpanish American IndianSri LankanSubsaharan AfricanSudaneseSwedishSwissSyrianTaiwaneseThaiTlingit-HaidaTohono O'OdhamTonganTrinidadian and TobagonianTsimshianTurkishU.S. Virgin IslanderUgandanUkrainianUruguayanUteVenezuelanVietnameseWelshWest IndianYakamaYaquiYugoslavianYumanYup'ikZimbabwean
Immigration
NonimmigrantsImmigrantsAfghanistanAfricaAlbaniaArgentinaArmeniaAsiaAustraliaAustriaBahamasBangladeshBarbadosBelarusBelgiumBelizeBoliviaBosnia and HerzegovinaBrazilBulgariaBurma/MyanmarCabo VerdeCambodiaCameroonCanadaCaribbeanCentral AmericaChileChinaColombiaCongoCosta RicaCroatiaCubaCzechoslovakiaDenmarkDominicaDominican RepublicEastern AfricaEastern AsiaEastern EuropeEcuadorEgyptEl SalvadorEnglandEritreaEthiopiaEuropeFijiFranceGermanyGhanaGreeceGrenadaGuatemalaGuyanaHaitiHondurasHong KongHungaryIndiaIndonesiaIranIraqIrelandIsraelItalyJamaicaJapanJordanKazakhstanKenyaKoreaKuwaitLaosLatin AmericaLatviaLebanonLiberiaLithuaniaMalaysiaMexicoMicronesiaMiddle AfricaMoldovaMoroccoNepalNetherlandsNicaraguaNigeriaNorth AmericaNorth MacedoniaNorthern AfricaNorthern EuropeNorwayOceaniaPakistanPanamaPeruPhilippinesPolandPortugalRomaniaRussiaSaudi ArabiaScotlandSenegalSerbiaSierra LeoneSingaporeSomaliaSouth AfricaSouth AmericaSouth Central AsiaSouth Eastern AsiaSouthern EuropeSpainSri LankaSt. Vincent and the GrenadinesSudanSwedenSwitzerlandSyriaTaiwanThailandTrinidad and TobagoTurkeyUgandaUkraineUruguayUzbekistanVenezuelaVietnamWest IndiesWestern AfricaWestern AsiaWestern EuropeYemenZaireZimbabweAzores
French American Indian
Race
Ancestry
AfghanAfricanAlaska NativeAlaskan AthabascanAlbanianAleutAlsatianAmericanApacheArabArapahoArgentineanArmenianAssyrian/Chaldean/SyriacAustralianAustrianBahamianBangladeshiBarbadianBasqueBelgianBelizeanBermudanBhutaneseBlackfeetBolivianBrazilianBritishBritish West IndianBulgarianBurmeseCajunCambodianCanadianCape VerdeanCarpatho RusynCelticCentral AmericanCentral American IndianCherokeeCheyenneChickasawChileanChineseChippewaChoctawColombianColvilleComancheCosta RicanCreeCreekCroatianCrowCubanCypriotCzechCzechoslovakianDanishDelawareDominicanDutchDutch West IndianEastern EuropeanEcuadorianEgyptianEnglishEstonianEthiopianEuropeanFijianFilipinoFinnishFrenchFrench American IndianFrench CanadianGermanGerman RussianGhanaianGreekGuamanian/ChamorroGuatemalanGuyaneseHaitianHmongHonduranHopiHoumaHungarianIcelanderIndian (Asian)IndonesianInupiatIranianIraqiIrishIroquoisIsraeliItalianJamaicanJapaneseJordanianKenyanKiowaKoreanLaotianLatvianLebaneseLiberianLithuanianLumbeeLuxembourgerMacedonianMalaysianMalteseMarshalleseMenomineeMexicanMexican American IndianMongolianNative HawaiianNavajoNepaleseNew ZealanderNicaraguanNigerianNorthern EuropeanNorwegianOkinawanOsageOttawaPaiutePakistaniPalestinianPanamanianParaguayanPennsylvania GermanPeruvianPimaPolishPortuguesePotawatomiPuebloPuerto RicanPuget Sound SalishRomanianRussianSalvadoranSamoanScandinavianScotch-IrishScottishSeminoleSenegaleseSerbianShoshoneSierra LeoneanSiouxSlavicSlovakSloveneSomaliSouth AfricanSouth AmericanSouth American IndianSoviet UnionSpaniardSpanishSpanish AmericanSpanish American IndianSri LankanSubsaharan AfricanSudaneseSwedishSwissSyrianTaiwaneseThaiTlingit-HaidaTohono O'OdhamTonganTrinidadian and TobagonianTsimshianTurkishU.S. Virgin IslanderUgandanUkrainianUruguayanUteVenezuelanVietnameseWelshWest IndianYakamaYaquiYugoslavianYumanYup'ikZimbabwean
Immigration
NonimmigrantsImmigrantsAfghanistanAfricaAlbaniaArgentinaArmeniaAsiaAustraliaAustriaBahamasBangladeshBarbadosBelarusBelgiumBelizeBoliviaBosnia and HerzegovinaBrazilBulgariaBurma/MyanmarCabo VerdeCambodiaCameroonCanadaCaribbeanCentral AmericaChileChinaColombiaCongoCosta RicaCroatiaCubaCzechoslovakiaDenmarkDominicaDominican RepublicEastern AfricaEastern AsiaEastern EuropeEcuadorEgyptEl SalvadorEnglandEritreaEthiopiaEuropeFijiFranceGermanyGhanaGreeceGrenadaGuatemalaGuyanaHaitiHondurasHong KongHungaryIndiaIndonesiaIranIraqIrelandIsraelItalyJamaicaJapanJordanKazakhstanKenyaKoreaKuwaitLaosLatin AmericaLatviaLebanonLiberiaLithuaniaMalaysiaMexicoMicronesiaMiddle AfricaMoldovaMoroccoNepalNetherlandsNicaraguaNigeriaNorth AmericaNorth MacedoniaNorthern AfricaNorthern EuropeNorwayOceaniaPakistanPanamaPeruPhilippinesPolandPortugalRomaniaRussiaSaudi ArabiaScotlandSenegalSerbiaSierra LeoneSingaporeSomaliaSouth AfricaSouth AmericaSouth Central AsiaSouth Eastern AsiaSouthern EuropeSpainSri LankaSt. Vincent and the GrenadinesSudanSwedenSwitzerlandSyriaTaiwanThailandTrinidad and TobagoTurkeyUgandaUkraineUruguayUzbekistanVenezuelaVietnamWest IndiesWestern AfricaWestern AsiaWestern EuropeYemenZaireZimbabweAzores
Disability Age Under 5
Income
Poverty
Unemployment
Labor Participation
Family Structure
Vehicle Availability
Education Level
Disability

Disability Age Under 5 Comparison

Moroccans

French American Indians

Excellent
Tragic
1.2%
DISABILITY AGE UNDER 5
83.6/ 100
METRIC RATING
136th/ 347
METRIC RANK
1.3%
DISABILITY AGE UNDER 5
4.5/ 100
METRIC RATING
232nd/ 347
METRIC RANK

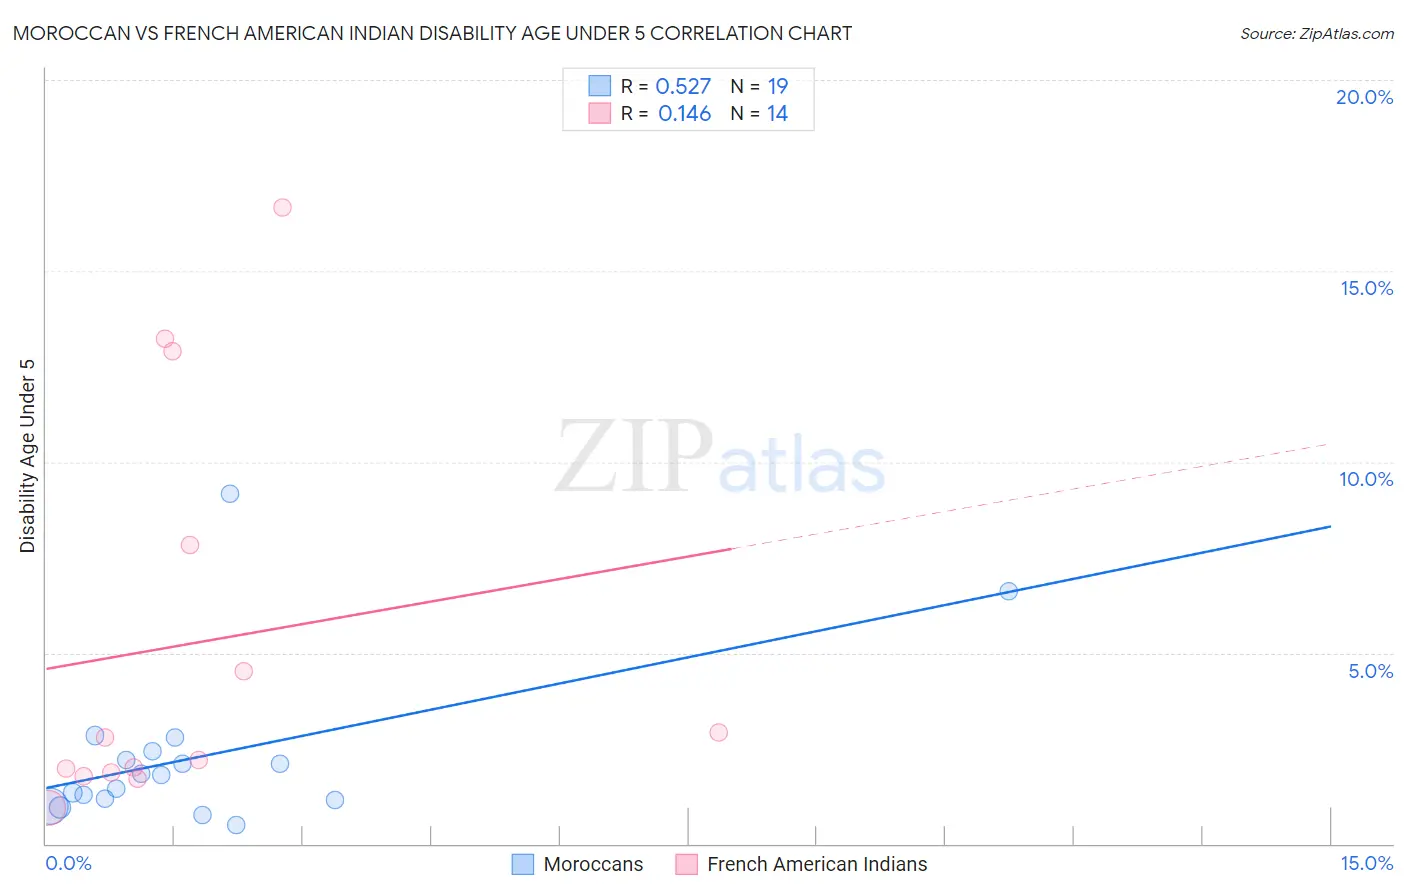
Moroccan vs French American Indian Disability Age Under 5 Correlation Chart

The statistical analysis conducted on geographies consisting of 132,015,425 people shows a substantial positive correlation between the proportion of Moroccans and percentage of population with a disability under the age of 5 in the United States with a correlation coefficient (R) of 0.527 and weighted average of 1.2%. Similarly, the statistical analysis conducted on geographies consisting of 94,727,352 people shows a poor positive correlation between the proportion of French American Indians and percentage of population with a disability under the age of 5 in the United States with a correlation coefficient (R) of 0.146 and weighted average of 1.3%, a difference of 11.0%.
Moroccan vs French American Indian Disability Age Under 5

Disability Age Under 5 Correlation Summary

MeasurementMoroccanFrench American Indian
Minimum0.49%0.93%
Maximum9.2%16.7%
Range8.7%15.7%
Mean2.3%5.2%
Median1.8%2.5%
Interquartile 25% (IQ1)1.2%1.9%
Interquartile 75% (IQ3)2.4%7.8%
Interquartile Range (IQR)1.3%5.9%
Standard Deviation (Sample)2.1%5.2%
Standard Deviation (Population)2.1%5.0%

Similar Demographics by Disability Age Under 5

Demographics Similar to Moroccans by Disability Age Under 5

In terms of disability age under 5, the demographic groups most similar to Moroccans are Immigrants from Eastern Africa (1.2%, a difference of 0.090%), Immigrants from Czechoslovakia (1.2%, a difference of 0.14%), Fijian (1.2%, a difference of 0.18%), New Zealander (1.2%, a difference of 0.37%), and Argentinean (1.2%, a difference of 0.38%).
DemographicsRating | RankDisability Age Under 5
Immigrants | Immigrants
88.0
/100
|
#129
Excellent
1.2%
Koreans
87.7
/100
|
#130
Excellent
1.2%
Immigrants | Serbia
87.6
/100
|
#131
Excellent
1.2%
Immigrants | Eastern Europe
87.3
/100
|
#132
Excellent
1.2%
Immigrants | Spain
86.5
/100
|
#133
Excellent
1.2%
Argentineans
85.7
/100
|
#134
Excellent
1.2%
Fijians
84.7
/100
|
#135
Excellent
1.2%
Moroccans
83.6
/100
|
#136
Excellent
1.2%
Immigrants | Eastern Africa
83.1
/100
|
#137
Excellent
1.2%
Immigrants | Czechoslovakia
82.8
/100
|
#138
Excellent
1.2%
New Zealanders
81.4
/100
|
#139
Excellent
1.2%
Somalis
80.8
/100
|
#140
Excellent
1.2%
Immigrants | Honduras
80.4
/100
|
#141
Excellent
1.2%
Immigrants | Colombia
79.3
/100
|
#142
Good
1.2%
Alsatians
79.3
/100
|
#143
Good
1.2%

Demographics Similar to French American Indians by Disability Age Under 5

In terms of disability age under 5, the demographic groups most similar to French American Indians are Tongan (1.3%, a difference of 0.12%), Immigrants from Northern Europe (1.3%, a difference of 0.13%), Lebanese (1.3%, a difference of 0.38%), Pueblo (1.3%, a difference of 0.38%), and Central American Indian (1.3%, a difference of 0.45%).
DemographicsRating | RankDisability Age Under 5
Panamanians
7.1
/100
|
#225
Tragic
1.3%
Bahamians
7.1
/100
|
#226
Tragic
1.3%
Taiwanese
6.1
/100
|
#227
Tragic
1.3%
Luxembourgers
6.1
/100
|
#228
Tragic
1.3%
Immigrants | Costa Rica
5.5
/100
|
#229
Tragic
1.3%
Lebanese
5.3
/100
|
#230
Tragic
1.3%
Immigrants | Northern Europe
4.7
/100
|
#231
Tragic
1.3%
French American Indians
4.5
/100
|
#232
Tragic
1.3%
Tongans
4.2
/100
|
#233
Tragic
1.3%
Pueblo
3.8
/100
|
#234
Tragic
1.3%
Central American Indians
3.6
/100
|
#235
Tragic
1.3%
South American Indians
3.3
/100
|
#236
Tragic
1.3%
Basques
3.0
/100
|
#237
Tragic
1.3%
Spanish American Indians
2.4
/100
|
#238
Tragic
1.3%
Immigrants | Austria
2.3
/100
|
#239
Tragic
1.3%