Immigrants from Chile vs Immigrants from Malaysia Disability Age Under 5
COMPARE
Immigrants from Chile
Immigrants from Malaysia
Disability Age Under 5
Disability Age Under 5 Comparison
Immigrants from Chile
Immigrants from Malaysia
1.3%
DISABILITY AGE UNDER 5
17.2/ 100
METRIC RATING
214th/ 347
METRIC RANK
1.1%
DISABILITY AGE UNDER 5
99.4/ 100
METRIC RATING
59th/ 347
METRIC RANK
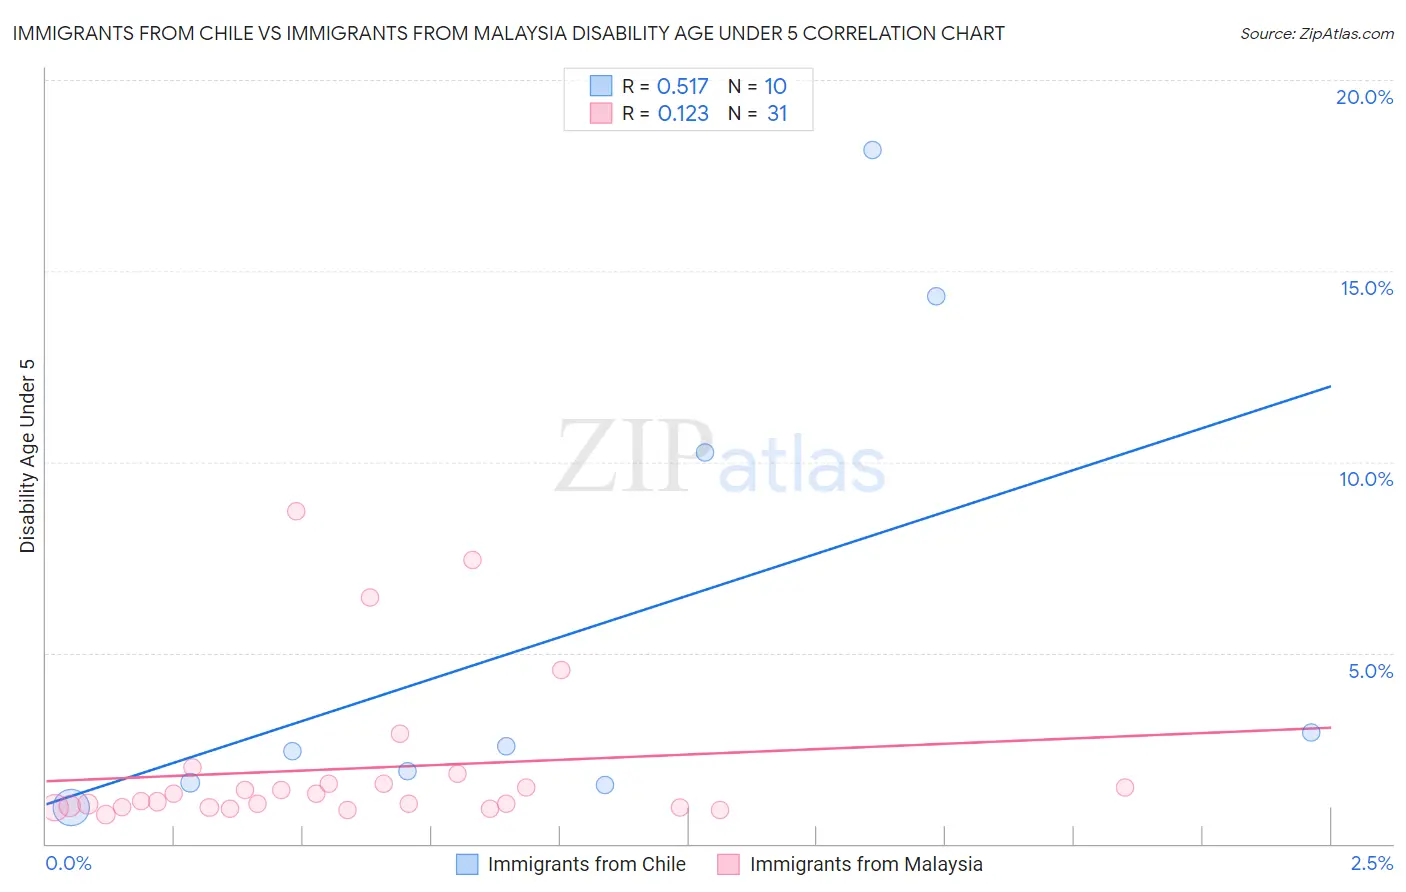
Immigrants from Chile vs Immigrants from Malaysia Disability Age Under 5 Correlation Chart
The statistical analysis conducted on geographies consisting of 142,107,365 people shows a substantial positive correlation between the proportion of Immigrants from Chile and percentage of population with a disability under the age of 5 in the United States with a correlation coefficient (R) of 0.517 and weighted average of 1.3%. Similarly, the statistical analysis conducted on geographies consisting of 132,664,021 people shows a poor positive correlation between the proportion of Immigrants from Malaysia and percentage of population with a disability under the age of 5 in the United States with a correlation coefficient (R) of 0.123 and weighted average of 1.1%, a difference of 17.0%.
Disability Age Under 5 Correlation Summary
| Measurement | Immigrants from Chile | Immigrants from Malaysia |
| Minimum | 0.94% | 0.76% |
| Maximum | 18.2% | 8.7% |
| Range | 17.2% | 7.9% |
| Mean | 5.7% | 2.0% |
| Median | 2.5% | 1.1% |
| Interquartile 25% (IQ1) | 1.6% | 0.95% |
| Interquartile 75% (IQ3) | 10.2% | 1.6% |
| Interquartile Range (IQR) | 8.6% | 0.61% |
| Standard Deviation (Sample) | 6.2% | 2.0% |
| Standard Deviation (Population) | 5.9% | 2.0% |
Similar Demographics by Disability Age Under 5
Demographics Similar to Immigrants from Chile by Disability Age Under 5
In terms of disability age under 5, the demographic groups most similar to Immigrants from Chile are Syrian (1.3%, a difference of 0.17%), Immigrants from Sudan (1.3%, a difference of 0.23%), Chilean (1.3%, a difference of 0.24%), Bangladeshi (1.3%, a difference of 0.27%), and Immigrants from Greece (1.3%, a difference of 0.29%).
| Demographics | Rating | Rank | Disability Age Under 5 |
| Nigerians | 21.2 /100 | #207 | Fair 1.3% |
| Mexicans | 20.8 /100 | #208 | Fair 1.3% |
| Bulgarians | 19.5 /100 | #209 | Poor 1.3% |
| Pakistanis | 19.4 /100 | #210 | Poor 1.3% |
| Immigrants | Greece | 19.1 /100 | #211 | Poor 1.3% |
| Chileans | 18.8 /100 | #212 | Poor 1.3% |
| Immigrants | Sudan | 18.7 /100 | #213 | Poor 1.3% |
| Immigrants | Chile | 17.2 /100 | #214 | Poor 1.3% |
| Syrians | 16.1 /100 | #215 | Poor 1.3% |
| Bangladeshis | 15.5 /100 | #216 | Poor 1.3% |
| Cypriots | 14.9 /100 | #217 | Poor 1.3% |
| Malaysians | 13.2 /100 | #218 | Poor 1.3% |
| Immigrants | Croatia | 11.2 /100 | #219 | Poor 1.3% |
| Serbians | 9.6 /100 | #220 | Tragic 1.3% |
| Sub-Saharan Africans | 8.3 /100 | #221 | Tragic 1.3% |
Demographics Similar to Immigrants from Malaysia by Disability Age Under 5
In terms of disability age under 5, the demographic groups most similar to Immigrants from Malaysia are Immigrants from Egypt (1.1%, a difference of 0.12%), Assyrian/Chaldean/Syriac (1.1%, a difference of 0.30%), Ecuadorian (1.1%, a difference of 0.33%), Salvadoran (1.1%, a difference of 0.73%), and Immigrants from Western Asia (1.1%, a difference of 0.76%).
| Demographics | Rating | Rank | Disability Age Under 5 |
| Immigrants | Bolivia | 99.6 /100 | #52 | Exceptional 1.1% |
| Asians | 99.6 /100 | #53 | Exceptional 1.1% |
| Immigrants | El Salvador | 99.6 /100 | #54 | Exceptional 1.1% |
| Salvadorans | 99.5 /100 | #55 | Exceptional 1.1% |
| Ecuadorians | 99.5 /100 | #56 | Exceptional 1.1% |
| Assyrians/Chaldeans/Syriacs | 99.5 /100 | #57 | Exceptional 1.1% |
| Immigrants | Egypt | 99.4 /100 | #58 | Exceptional 1.1% |
| Immigrants | Malaysia | 99.4 /100 | #59 | Exceptional 1.1% |
| Immigrants | Western Asia | 99.2 /100 | #60 | Exceptional 1.1% |
| Immigrants | Ethiopia | 99.2 /100 | #61 | Exceptional 1.1% |
| Immigrants | Switzerland | 99.2 /100 | #62 | Exceptional 1.1% |
| Immigrants | Vietnam | 99.1 /100 | #63 | Exceptional 1.1% |
| Egyptians | 98.9 /100 | #64 | Exceptional 1.1% |
| Immigrants | Korea | 98.8 /100 | #65 | Exceptional 1.1% |
| Immigrants | Indonesia | 98.7 /100 | #66 | Exceptional 1.1% |