Bahamian vs Immigrants from Malaysia Disability Age Under 5
COMPARE
Bahamian
Immigrants from Malaysia
Disability Age Under 5
Disability Age Under 5 Comparison
Bahamians
Immigrants from Malaysia
1.3%
DISABILITY AGE UNDER 5
7.1/ 100
METRIC RATING
226th/ 347
METRIC RANK
1.1%
DISABILITY AGE UNDER 5
99.4/ 100
METRIC RATING
59th/ 347
METRIC RANK
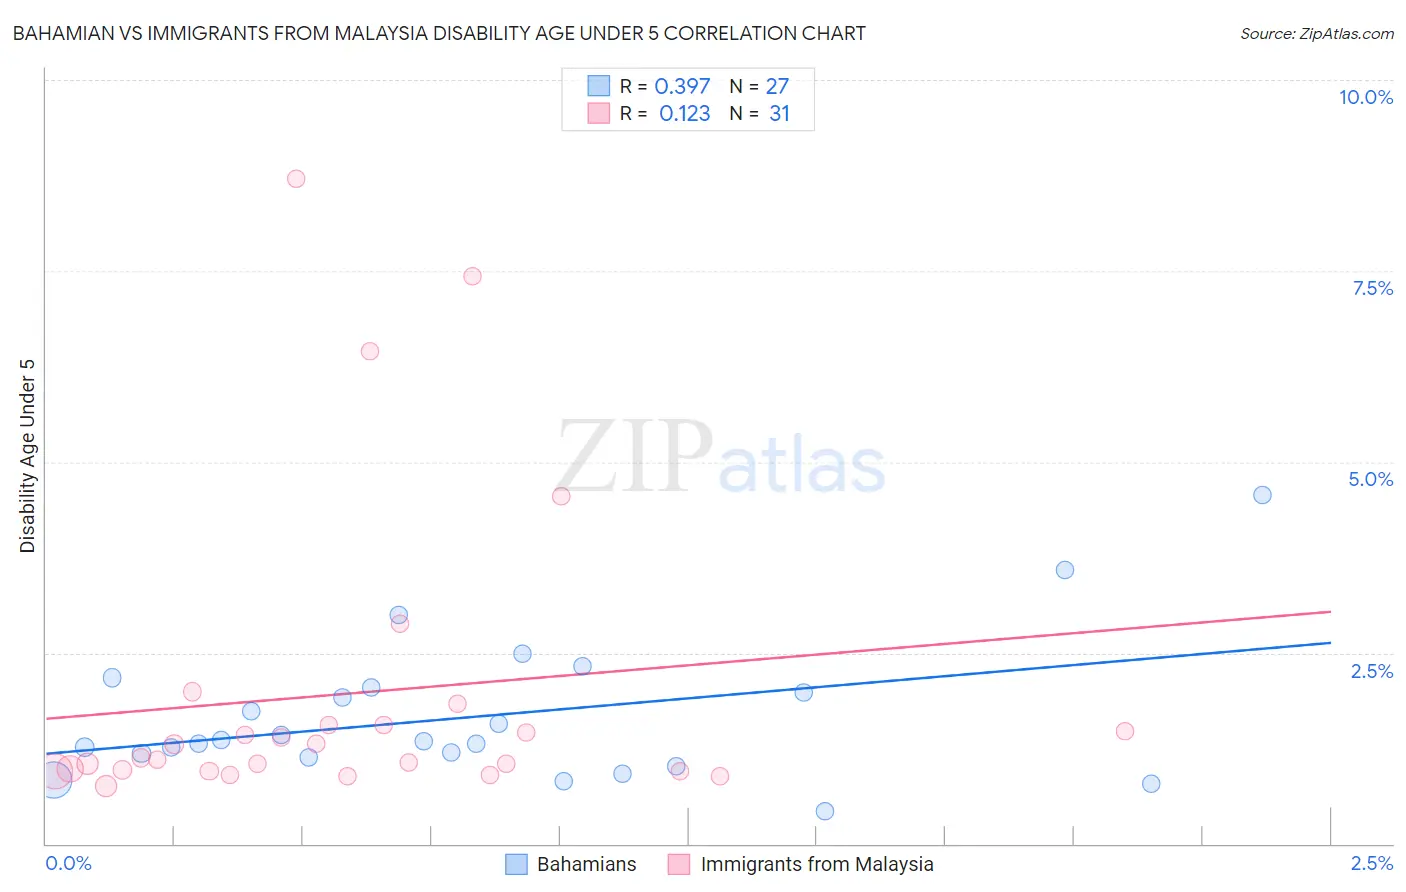
Bahamian vs Immigrants from Malaysia Disability Age Under 5 Correlation Chart
The statistical analysis conducted on geographies consisting of 81,811,004 people shows a mild positive correlation between the proportion of Bahamians and percentage of population with a disability under the age of 5 in the United States with a correlation coefficient (R) of 0.397 and weighted average of 1.3%. Similarly, the statistical analysis conducted on geographies consisting of 132,664,021 people shows a poor positive correlation between the proportion of Immigrants from Malaysia and percentage of population with a disability under the age of 5 in the United States with a correlation coefficient (R) of 0.123 and weighted average of 1.1%, a difference of 19.6%.
Disability Age Under 5 Correlation Summary
| Measurement | Bahamian | Immigrants from Malaysia |
| Minimum | 0.43% | 0.76% |
| Maximum | 4.6% | 8.7% |
| Range | 4.1% | 7.9% |
| Mean | 1.7% | 2.0% |
| Median | 1.3% | 1.1% |
| Interquartile 25% (IQ1) | 1.1% | 0.95% |
| Interquartile 75% (IQ3) | 2.0% | 1.6% |
| Interquartile Range (IQR) | 0.92% | 0.61% |
| Standard Deviation (Sample) | 0.92% | 2.0% |
| Standard Deviation (Population) | 0.90% | 2.0% |
Similar Demographics by Disability Age Under 5
Demographics Similar to Bahamians by Disability Age Under 5
In terms of disability age under 5, the demographic groups most similar to Bahamians are Panamanian (1.3%, a difference of 0.0%), Latvian (1.3%, a difference of 0.030%), Hispanic or Latino (1.3%, a difference of 0.19%), Taiwanese (1.3%, a difference of 0.34%), and Luxembourger (1.3%, a difference of 0.35%).
| Demographics | Rating | Rank | Disability Age Under 5 |
| Immigrants | Croatia | 11.2 /100 | #219 | Poor 1.3% |
| Serbians | 9.6 /100 | #220 | Tragic 1.3% |
| Sub-Saharan Africans | 8.3 /100 | #221 | Tragic 1.3% |
| Ukrainians | 8.3 /100 | #222 | Tragic 1.3% |
| Hispanics or Latinos | 7.7 /100 | #223 | Tragic 1.3% |
| Latvians | 7.1 /100 | #224 | Tragic 1.3% |
| Panamanians | 7.1 /100 | #225 | Tragic 1.3% |
| Bahamians | 7.1 /100 | #226 | Tragic 1.3% |
| Taiwanese | 6.1 /100 | #227 | Tragic 1.3% |
| Luxembourgers | 6.1 /100 | #228 | Tragic 1.3% |
| Immigrants | Costa Rica | 5.5 /100 | #229 | Tragic 1.3% |
| Lebanese | 5.3 /100 | #230 | Tragic 1.3% |
| Immigrants | Northern Europe | 4.7 /100 | #231 | Tragic 1.3% |
| French American Indians | 4.5 /100 | #232 | Tragic 1.3% |
| Tongans | 4.2 /100 | #233 | Tragic 1.3% |
Demographics Similar to Immigrants from Malaysia by Disability Age Under 5
In terms of disability age under 5, the demographic groups most similar to Immigrants from Malaysia are Immigrants from Egypt (1.1%, a difference of 0.12%), Assyrian/Chaldean/Syriac (1.1%, a difference of 0.30%), Ecuadorian (1.1%, a difference of 0.33%), Salvadoran (1.1%, a difference of 0.73%), and Immigrants from Western Asia (1.1%, a difference of 0.76%).
| Demographics | Rating | Rank | Disability Age Under 5 |
| Immigrants | Bolivia | 99.6 /100 | #52 | Exceptional 1.1% |
| Asians | 99.6 /100 | #53 | Exceptional 1.1% |
| Immigrants | El Salvador | 99.6 /100 | #54 | Exceptional 1.1% |
| Salvadorans | 99.5 /100 | #55 | Exceptional 1.1% |
| Ecuadorians | 99.5 /100 | #56 | Exceptional 1.1% |
| Assyrians/Chaldeans/Syriacs | 99.5 /100 | #57 | Exceptional 1.1% |
| Immigrants | Egypt | 99.4 /100 | #58 | Exceptional 1.1% |
| Immigrants | Malaysia | 99.4 /100 | #59 | Exceptional 1.1% |
| Immigrants | Western Asia | 99.2 /100 | #60 | Exceptional 1.1% |
| Immigrants | Ethiopia | 99.2 /100 | #61 | Exceptional 1.1% |
| Immigrants | Switzerland | 99.2 /100 | #62 | Exceptional 1.1% |
| Immigrants | Vietnam | 99.1 /100 | #63 | Exceptional 1.1% |
| Egyptians | 98.9 /100 | #64 | Exceptional 1.1% |
| Immigrants | Korea | 98.8 /100 | #65 | Exceptional 1.1% |
| Immigrants | Indonesia | 98.7 /100 | #66 | Exceptional 1.1% |