Mongolian vs Arab Cognitive Disability
COMPARE
Mongolian
Arab
Cognitive Disability
Cognitive Disability Comparison
Mongolians
Arabs
17.7%
COGNITIVE DISABILITY
2.2/ 100
METRIC RATING
230th/ 347
METRIC RANK
17.3%
COGNITIVE DISABILITY
42.8/ 100
METRIC RATING
182nd/ 347
METRIC RANK
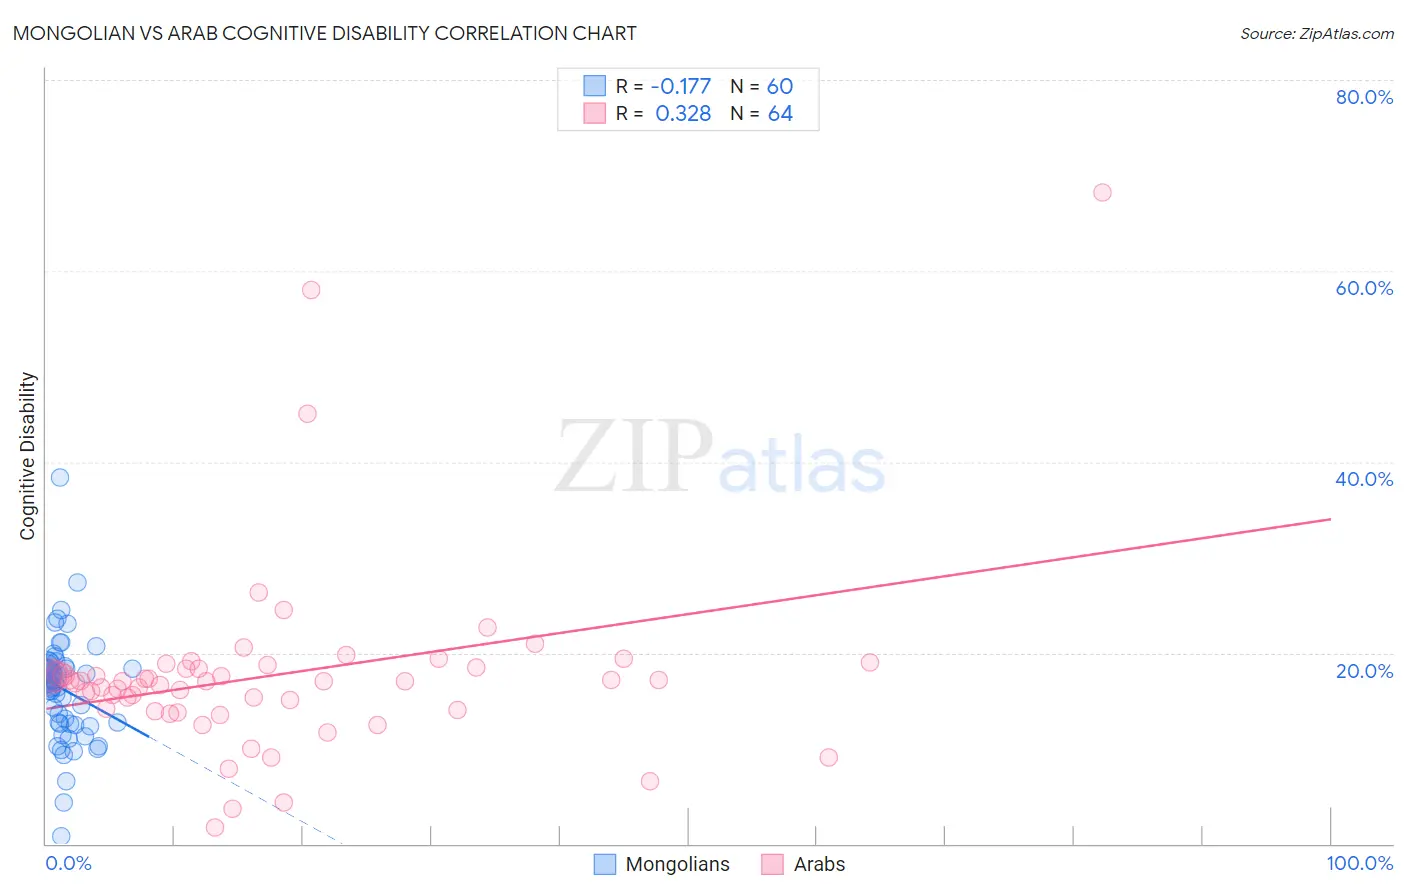
Mongolian vs Arab Cognitive Disability Correlation Chart
The statistical analysis conducted on geographies consisting of 140,359,372 people shows a poor negative correlation between the proportion of Mongolians and percentage of population with cognitive disability in the United States with a correlation coefficient (R) of -0.177 and weighted average of 17.7%. Similarly, the statistical analysis conducted on geographies consisting of 486,790,065 people shows a mild positive correlation between the proportion of Arabs and percentage of population with cognitive disability in the United States with a correlation coefficient (R) of 0.328 and weighted average of 17.3%, a difference of 2.5%.
Cognitive Disability Correlation Summary
| Measurement | Mongolian | Arab |
| Minimum | 0.74% | 1.6% |
| Maximum | 38.3% | 68.2% |
| Range | 37.6% | 66.6% |
| Mean | 16.1% | 17.7% |
| Median | 16.8% | 17.1% |
| Interquartile 25% (IQ1) | 12.6% | 14.1% |
| Interquartile 75% (IQ3) | 18.7% | 18.4% |
| Interquartile Range (IQR) | 6.1% | 4.3% |
| Standard Deviation (Sample) | 5.7% | 10.1% |
| Standard Deviation (Population) | 5.6% | 10.0% |
Similar Demographics by Cognitive Disability
Demographics Similar to Mongolians by Cognitive Disability
In terms of cognitive disability, the demographic groups most similar to Mongolians are Immigrants from Guatemala (17.7%, a difference of 0.020%), Guatemalan (17.8%, a difference of 0.030%), Tongan (17.8%, a difference of 0.030%), Panamanian (17.8%, a difference of 0.040%), and Immigrants from Central America (17.7%, a difference of 0.050%).
| Demographics | Rating | Rank | Cognitive Disability |
| Alsatians | 4.5 /100 | #223 | Tragic 17.7% |
| Fijians | 3.4 /100 | #224 | Tragic 17.7% |
| Vietnamese | 3.4 /100 | #225 | Tragic 17.7% |
| Marshallese | 2.7 /100 | #226 | Tragic 17.7% |
| Immigrants | St. Vincent and the Grenadines | 2.6 /100 | #227 | Tragic 17.7% |
| Immigrants | Central America | 2.3 /100 | #228 | Tragic 17.7% |
| Immigrants | Guatemala | 2.2 /100 | #229 | Tragic 17.7% |
| Mongolians | 2.2 /100 | #230 | Tragic 17.7% |
| Guatemalans | 2.1 /100 | #231 | Tragic 17.8% |
| Tongans | 2.1 /100 | #232 | Tragic 17.8% |
| Panamanians | 2.1 /100 | #233 | Tragic 17.8% |
| Osage | 2.0 /100 | #234 | Tragic 17.8% |
| Spanish American Indians | 2.0 /100 | #235 | Tragic 17.8% |
| Immigrants | Iraq | 1.8 /100 | #236 | Tragic 17.8% |
| Immigrants | Mexico | 1.8 /100 | #237 | Tragic 17.8% |
Demographics Similar to Arabs by Cognitive Disability
In terms of cognitive disability, the demographic groups most similar to Arabs are Immigrants from Guyana (17.3%, a difference of 0.0%), Pakistani (17.3%, a difference of 0.030%), Spaniard (17.3%, a difference of 0.070%), Crow (17.3%, a difference of 0.11%), and Afghan (17.3%, a difference of 0.14%).
| Demographics | Rating | Rank | Cognitive Disability |
| Tsimshian | 49.8 /100 | #175 | Average 17.3% |
| Shoshone | 49.2 /100 | #176 | Average 17.3% |
| Ute | 49.1 /100 | #177 | Average 17.3% |
| Spanish | 48.9 /100 | #178 | Average 17.3% |
| Sioux | 48.6 /100 | #179 | Average 17.3% |
| Pakistanis | 43.9 /100 | #180 | Average 17.3% |
| Immigrants | Guyana | 42.9 /100 | #181 | Average 17.3% |
| Arabs | 42.8 /100 | #182 | Average 17.3% |
| Spaniards | 40.3 /100 | #183 | Average 17.3% |
| Crow | 39.1 /100 | #184 | Fair 17.3% |
| Afghans | 38.2 /100 | #185 | Fair 17.3% |
| Cambodians | 35.9 /100 | #186 | Fair 17.3% |
| Immigrants | Fiji | 33.7 /100 | #187 | Fair 17.4% |
| Immigrants | France | 29.8 /100 | #188 | Fair 17.4% |
| Immigrants | Western Asia | 29.5 /100 | #189 | Fair 17.4% |