Lebanese vs Arab Cognitive Disability
COMPARE
Lebanese
Arab
Cognitive Disability
Cognitive Disability Comparison
Lebanese
Arabs
17.0%
COGNITIVE DISABILITY
91.3/ 100
METRIC RATING
135th/ 347
METRIC RANK
17.3%
COGNITIVE DISABILITY
42.8/ 100
METRIC RATING
182nd/ 347
METRIC RANK
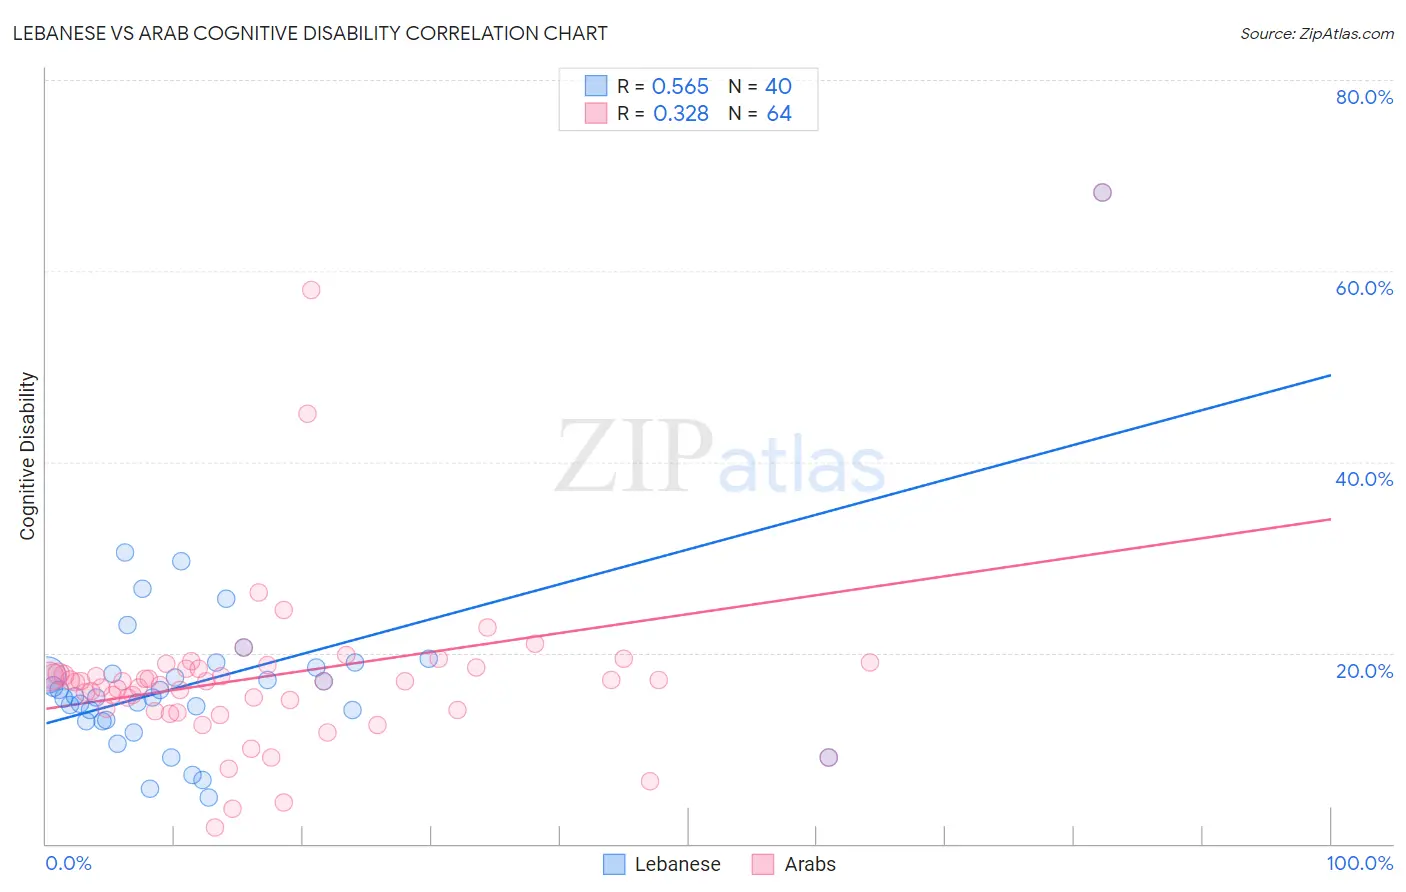
Lebanese vs Arab Cognitive Disability Correlation Chart
The statistical analysis conducted on geographies consisting of 401,594,018 people shows a substantial positive correlation between the proportion of Lebanese and percentage of population with cognitive disability in the United States with a correlation coefficient (R) of 0.565 and weighted average of 17.0%. Similarly, the statistical analysis conducted on geographies consisting of 486,790,065 people shows a mild positive correlation between the proportion of Arabs and percentage of population with cognitive disability in the United States with a correlation coefficient (R) of 0.328 and weighted average of 17.3%, a difference of 1.9%.
Cognitive Disability Correlation Summary
| Measurement | Lebanese | Arab |
| Minimum | 4.9% | 1.6% |
| Maximum | 68.2% | 68.2% |
| Range | 63.4% | 66.6% |
| Mean | 17.2% | 17.7% |
| Median | 15.4% | 17.1% |
| Interquartile 25% (IQ1) | 12.9% | 14.1% |
| Interquartile 75% (IQ3) | 18.7% | 18.4% |
| Interquartile Range (IQR) | 5.9% | 4.3% |
| Standard Deviation (Sample) | 10.1% | 10.1% |
| Standard Deviation (Population) | 10.0% | 10.0% |
Similar Demographics by Cognitive Disability
Demographics Similar to Lebanese by Cognitive Disability
In terms of cognitive disability, the demographic groups most similar to Lebanese are Israeli (17.0%, a difference of 0.030%), Immigrants from Norway (17.0%, a difference of 0.030%), Immigrants from Chile (17.0%, a difference of 0.040%), Welsh (17.0%, a difference of 0.050%), and Immigrants from Jordan (17.0%, a difference of 0.060%).
| Demographics | Rating | Rank | Cognitive Disability |
| Nicaraguans | 93.0 /100 | #128 | Exceptional 17.0% |
| Immigrants | Uruguay | 92.9 /100 | #129 | Exceptional 17.0% |
| Immigrants | Vietnam | 92.4 /100 | #130 | Exceptional 17.0% |
| Immigrants | Germany | 92.1 /100 | #131 | Exceptional 17.0% |
| Whites/Caucasians | 92.1 /100 | #132 | Exceptional 17.0% |
| Immigrants | Jordan | 91.9 /100 | #133 | Exceptional 17.0% |
| Immigrants | Chile | 91.7 /100 | #134 | Exceptional 17.0% |
| Lebanese | 91.3 /100 | #135 | Exceptional 17.0% |
| Israelis | 91.0 /100 | #136 | Exceptional 17.0% |
| Immigrants | Norway | 90.9 /100 | #137 | Exceptional 17.0% |
| Welsh | 90.8 /100 | #138 | Exceptional 17.0% |
| French | 90.0 /100 | #139 | Excellent 17.0% |
| Chileans | 89.9 /100 | #140 | Excellent 17.0% |
| Aleuts | 89.9 /100 | #141 | Excellent 17.0% |
| Carpatho Rusyns | 89.6 /100 | #142 | Excellent 17.0% |
Demographics Similar to Arabs by Cognitive Disability
In terms of cognitive disability, the demographic groups most similar to Arabs are Immigrants from Guyana (17.3%, a difference of 0.0%), Pakistani (17.3%, a difference of 0.030%), Spaniard (17.3%, a difference of 0.070%), Crow (17.3%, a difference of 0.11%), and Afghan (17.3%, a difference of 0.14%).
| Demographics | Rating | Rank | Cognitive Disability |
| Tsimshian | 49.8 /100 | #175 | Average 17.3% |
| Shoshone | 49.2 /100 | #176 | Average 17.3% |
| Ute | 49.1 /100 | #177 | Average 17.3% |
| Spanish | 48.9 /100 | #178 | Average 17.3% |
| Sioux | 48.6 /100 | #179 | Average 17.3% |
| Pakistanis | 43.9 /100 | #180 | Average 17.3% |
| Immigrants | Guyana | 42.9 /100 | #181 | Average 17.3% |
| Arabs | 42.8 /100 | #182 | Average 17.3% |
| Spaniards | 40.3 /100 | #183 | Average 17.3% |
| Crow | 39.1 /100 | #184 | Fair 17.3% |
| Afghans | 38.2 /100 | #185 | Fair 17.3% |
| Cambodians | 35.9 /100 | #186 | Fair 17.3% |
| Immigrants | Fiji | 33.7 /100 | #187 | Fair 17.4% |
| Immigrants | France | 29.8 /100 | #188 | Fair 17.4% |
| Immigrants | Western Asia | 29.5 /100 | #189 | Fair 17.4% |