Mongolian vs Yakama Cognitive Disability
COMPARE
Mongolian
Yakama
Cognitive Disability
Cognitive Disability Comparison
Mongolians
Yakama
17.7%
COGNITIVE DISABILITY
2.2/ 100
METRIC RATING
230th/ 347
METRIC RANK
18.1%
COGNITIVE DISABILITY
0.1/ 100
METRIC RATING
281st/ 347
METRIC RANK
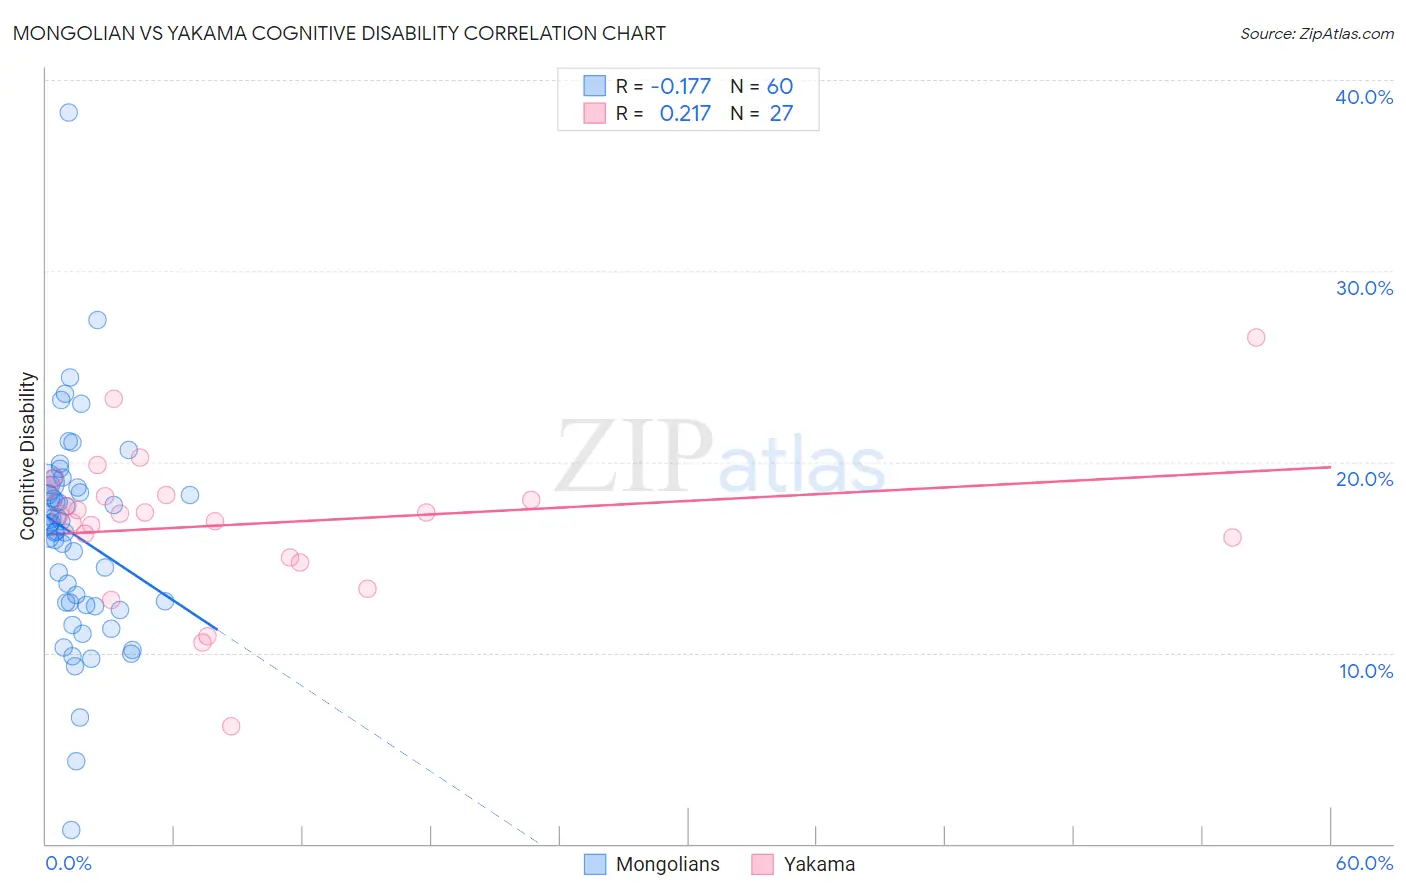
Mongolian vs Yakama Cognitive Disability Correlation Chart
The statistical analysis conducted on geographies consisting of 140,359,372 people shows a poor negative correlation between the proportion of Mongolians and percentage of population with cognitive disability in the United States with a correlation coefficient (R) of -0.177 and weighted average of 17.7%. Similarly, the statistical analysis conducted on geographies consisting of 19,917,879 people shows a weak positive correlation between the proportion of Yakama and percentage of population with cognitive disability in the United States with a correlation coefficient (R) of 0.217 and weighted average of 18.1%, a difference of 2.0%.
Cognitive Disability Correlation Summary
| Measurement | Mongolian | Yakama |
| Minimum | 0.74% | 6.1% |
| Maximum | 38.3% | 26.5% |
| Range | 37.6% | 20.4% |
| Mean | 16.1% | 16.8% |
| Median | 16.8% | 17.3% |
| Interquartile 25% (IQ1) | 12.6% | 15.0% |
| Interquartile 75% (IQ3) | 18.7% | 18.3% |
| Interquartile Range (IQR) | 6.1% | 3.3% |
| Standard Deviation (Sample) | 5.7% | 3.9% |
| Standard Deviation (Population) | 5.6% | 3.8% |
Similar Demographics by Cognitive Disability
Demographics Similar to Mongolians by Cognitive Disability
In terms of cognitive disability, the demographic groups most similar to Mongolians are Immigrants from Guatemala (17.7%, a difference of 0.020%), Guatemalan (17.8%, a difference of 0.030%), Tongan (17.8%, a difference of 0.030%), Panamanian (17.8%, a difference of 0.040%), and Immigrants from Central America (17.7%, a difference of 0.050%).
| Demographics | Rating | Rank | Cognitive Disability |
| Alsatians | 4.5 /100 | #223 | Tragic 17.7% |
| Fijians | 3.4 /100 | #224 | Tragic 17.7% |
| Vietnamese | 3.4 /100 | #225 | Tragic 17.7% |
| Marshallese | 2.7 /100 | #226 | Tragic 17.7% |
| Immigrants | St. Vincent and the Grenadines | 2.6 /100 | #227 | Tragic 17.7% |
| Immigrants | Central America | 2.3 /100 | #228 | Tragic 17.7% |
| Immigrants | Guatemala | 2.2 /100 | #229 | Tragic 17.7% |
| Mongolians | 2.2 /100 | #230 | Tragic 17.7% |
| Guatemalans | 2.1 /100 | #231 | Tragic 17.8% |
| Tongans | 2.1 /100 | #232 | Tragic 17.8% |
| Panamanians | 2.1 /100 | #233 | Tragic 17.8% |
| Osage | 2.0 /100 | #234 | Tragic 17.8% |
| Spanish American Indians | 2.0 /100 | #235 | Tragic 17.8% |
| Immigrants | Iraq | 1.8 /100 | #236 | Tragic 17.8% |
| Immigrants | Mexico | 1.8 /100 | #237 | Tragic 17.8% |
Demographics Similar to Yakama by Cognitive Disability
In terms of cognitive disability, the demographic groups most similar to Yakama are Immigrants from Cambodia (18.1%, a difference of 0.020%), Nigerian (18.1%, a difference of 0.050%), Immigrants from Uganda (18.1%, a difference of 0.090%), Bermudan (18.1%, a difference of 0.10%), and West Indian (18.1%, a difference of 0.12%).
| Demographics | Rating | Rank | Cognitive Disability |
| Immigrants | Nigeria | 0.2 /100 | #274 | Tragic 18.0% |
| Immigrants | Laos | 0.2 /100 | #275 | Tragic 18.1% |
| Yuman | 0.2 /100 | #276 | Tragic 18.1% |
| Immigrants | Kuwait | 0.2 /100 | #277 | Tragic 18.1% |
| Immigrants | Micronesia | 0.2 /100 | #278 | Tragic 18.1% |
| Chippewa | 0.1 /100 | #279 | Tragic 18.1% |
| West Indians | 0.1 /100 | #280 | Tragic 18.1% |
| Yakama | 0.1 /100 | #281 | Tragic 18.1% |
| Immigrants | Cambodia | 0.1 /100 | #282 | Tragic 18.1% |
| Nigerians | 0.1 /100 | #283 | Tragic 18.1% |
| Immigrants | Uganda | 0.1 /100 | #284 | Tragic 18.1% |
| Bermudans | 0.1 /100 | #285 | Tragic 18.1% |
| Kenyans | 0.1 /100 | #286 | Tragic 18.1% |
| Dutch West Indians | 0.1 /100 | #287 | Tragic 18.1% |
| Immigrants | West Indies | 0.1 /100 | #288 | Tragic 18.1% |