Mongolian vs Immigrants from Latin America Cognitive Disability
COMPARE
Mongolian
Immigrants from Latin America
Cognitive Disability
Cognitive Disability Comparison
Mongolians
Immigrants from Latin America
17.7%
COGNITIVE DISABILITY
2.2/ 100
METRIC RATING
230th/ 347
METRIC RANK
17.6%
COGNITIVE DISABILITY
9.7/ 100
METRIC RATING
207th/ 347
METRIC RANK
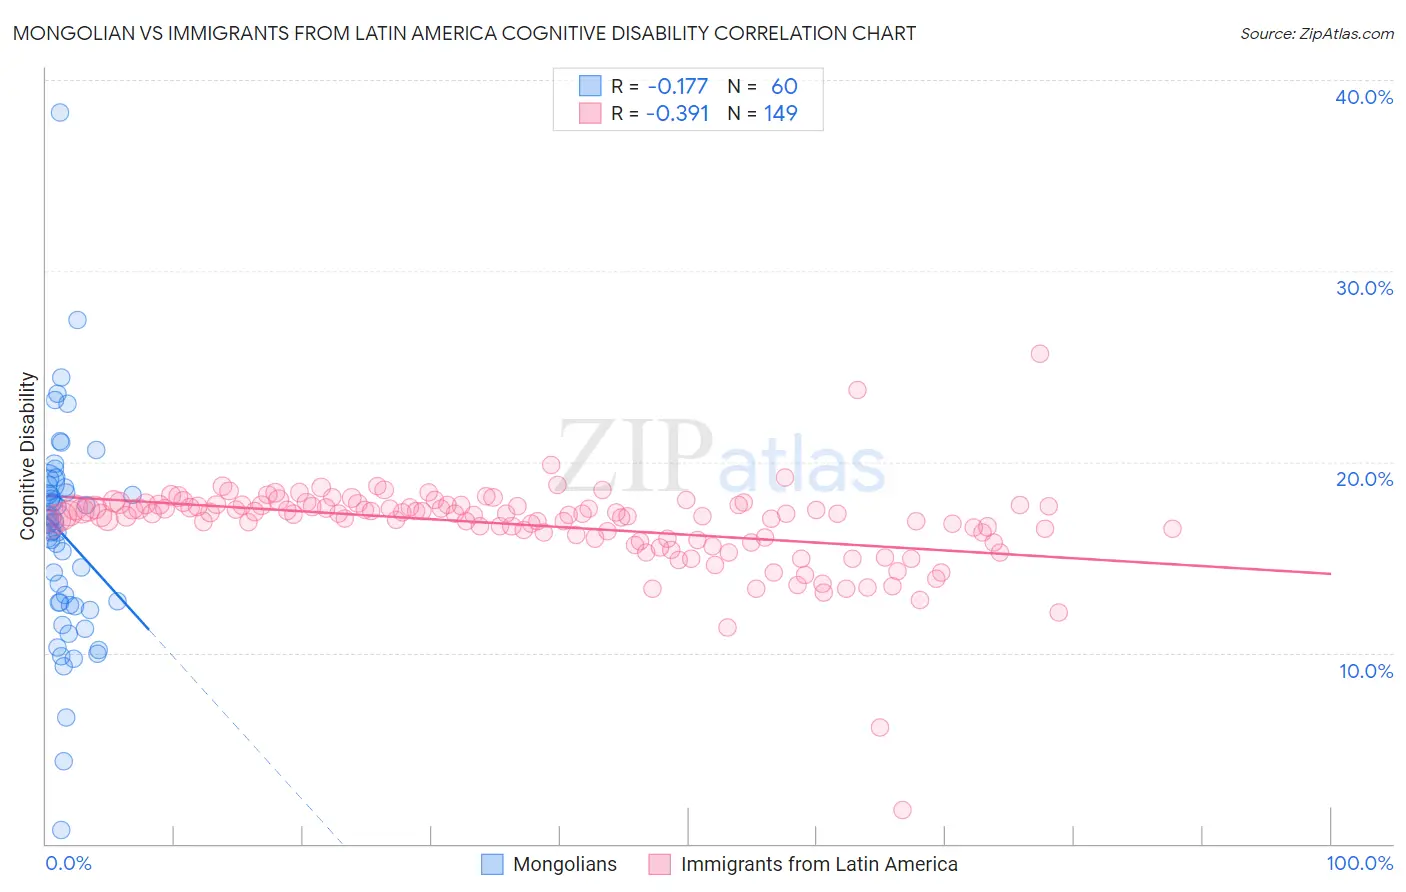
Mongolian vs Immigrants from Latin America Cognitive Disability Correlation Chart
The statistical analysis conducted on geographies consisting of 140,359,372 people shows a poor negative correlation between the proportion of Mongolians and percentage of population with cognitive disability in the United States with a correlation coefficient (R) of -0.177 and weighted average of 17.7%. Similarly, the statistical analysis conducted on geographies consisting of 558,464,403 people shows a mild negative correlation between the proportion of Immigrants from Latin America and percentage of population with cognitive disability in the United States with a correlation coefficient (R) of -0.391 and weighted average of 17.6%, a difference of 1.1%.
Cognitive Disability Correlation Summary
| Measurement | Mongolian | Immigrants from Latin America |
| Minimum | 0.74% | 1.8% |
| Maximum | 38.3% | 25.7% |
| Range | 37.6% | 23.9% |
| Mean | 16.1% | 16.7% |
| Median | 16.8% | 17.3% |
| Interquartile 25% (IQ1) | 12.6% | 16.0% |
| Interquartile 75% (IQ3) | 18.7% | 17.7% |
| Interquartile Range (IQR) | 6.1% | 1.7% |
| Standard Deviation (Sample) | 5.7% | 2.3% |
| Standard Deviation (Population) | 5.6% | 2.3% |
Similar Demographics by Cognitive Disability
Demographics Similar to Mongolians by Cognitive Disability
In terms of cognitive disability, the demographic groups most similar to Mongolians are Immigrants from Guatemala (17.7%, a difference of 0.020%), Guatemalan (17.8%, a difference of 0.030%), Tongan (17.8%, a difference of 0.030%), Panamanian (17.8%, a difference of 0.040%), and Immigrants from Central America (17.7%, a difference of 0.050%).
| Demographics | Rating | Rank | Cognitive Disability |
| Alsatians | 4.5 /100 | #223 | Tragic 17.7% |
| Fijians | 3.4 /100 | #224 | Tragic 17.7% |
| Vietnamese | 3.4 /100 | #225 | Tragic 17.7% |
| Marshallese | 2.7 /100 | #226 | Tragic 17.7% |
| Immigrants | St. Vincent and the Grenadines | 2.6 /100 | #227 | Tragic 17.7% |
| Immigrants | Central America | 2.3 /100 | #228 | Tragic 17.7% |
| Immigrants | Guatemala | 2.2 /100 | #229 | Tragic 17.7% |
| Mongolians | 2.2 /100 | #230 | Tragic 17.7% |
| Guatemalans | 2.1 /100 | #231 | Tragic 17.8% |
| Tongans | 2.1 /100 | #232 | Tragic 17.8% |
| Panamanians | 2.1 /100 | #233 | Tragic 17.8% |
| Osage | 2.0 /100 | #234 | Tragic 17.8% |
| Spanish American Indians | 2.0 /100 | #235 | Tragic 17.8% |
| Immigrants | Iraq | 1.8 /100 | #236 | Tragic 17.8% |
| Immigrants | Mexico | 1.8 /100 | #237 | Tragic 17.8% |
Demographics Similar to Immigrants from Latin America by Cognitive Disability
In terms of cognitive disability, the demographic groups most similar to Immigrants from Latin America are Immigrants from Cameroon (17.6%, a difference of 0.030%), Alaska Native (17.5%, a difference of 0.050%), Immigrants from Trinidad and Tobago (17.6%, a difference of 0.080%), Puget Sound Salish (17.5%, a difference of 0.090%), and Immigrants from Caribbean (17.5%, a difference of 0.10%).
| Demographics | Rating | Rank | Cognitive Disability |
| Haitians | 14.1 /100 | #200 | Poor 17.5% |
| South American Indians | 13.0 /100 | #201 | Poor 17.5% |
| Immigrants | Morocco | 12.0 /100 | #202 | Poor 17.5% |
| Immigrants | Caribbean | 11.0 /100 | #203 | Poor 17.5% |
| Immigrants | Zimbabwe | 11.0 /100 | #204 | Poor 17.5% |
| Puget Sound Salish | 10.9 /100 | #205 | Poor 17.5% |
| Alaska Natives | 10.4 /100 | #206 | Poor 17.5% |
| Immigrants | Latin America | 9.7 /100 | #207 | Tragic 17.6% |
| Immigrants | Cameroon | 9.3 /100 | #208 | Tragic 17.6% |
| Immigrants | Trinidad and Tobago | 8.7 /100 | #209 | Tragic 17.6% |
| Immigrants | Jamaica | 8.5 /100 | #210 | Tragic 17.6% |
| Taiwanese | 7.7 /100 | #211 | Tragic 17.6% |
| Immigrants | Oceania | 7.3 /100 | #212 | Tragic 17.6% |
| Hawaiians | 7.2 /100 | #213 | Tragic 17.6% |
| Immigrants | El Salvador | 7.0 /100 | #214 | Tragic 17.6% |