Mongolian vs Croatian Cognitive Disability
COMPARE
Mongolian
Croatian
Cognitive Disability
Cognitive Disability Comparison
Mongolians
Croatians
17.7%
COGNITIVE DISABILITY
2.2/ 100
METRIC RATING
230th/ 347
METRIC RANK
16.4%
COGNITIVE DISABILITY
99.9/ 100
METRIC RATING
23rd/ 347
METRIC RANK
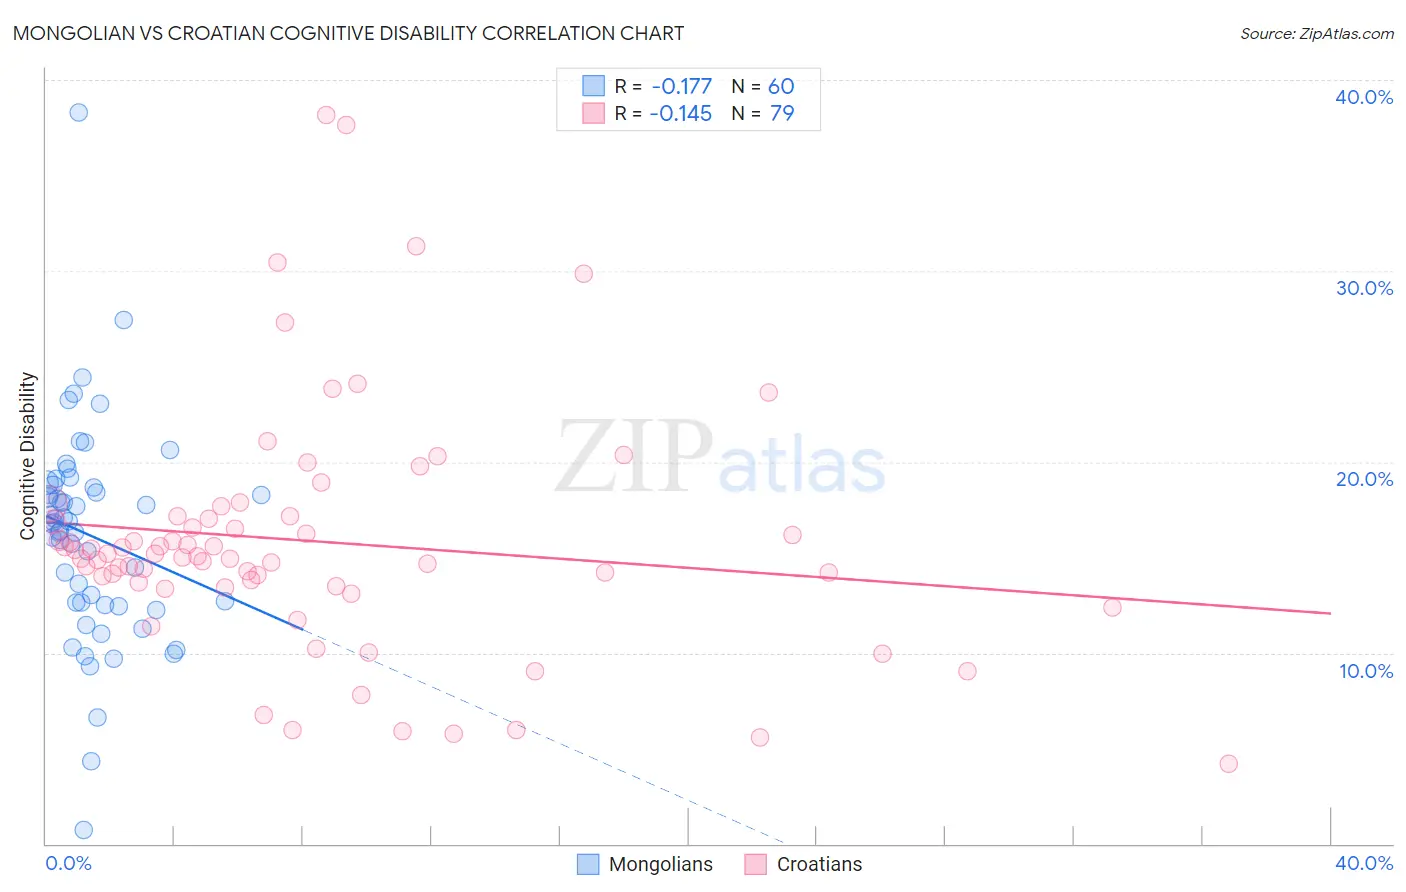
Mongolian vs Croatian Cognitive Disability Correlation Chart
The statistical analysis conducted on geographies consisting of 140,359,372 people shows a poor negative correlation between the proportion of Mongolians and percentage of population with cognitive disability in the United States with a correlation coefficient (R) of -0.177 and weighted average of 17.7%. Similarly, the statistical analysis conducted on geographies consisting of 375,711,663 people shows a poor negative correlation between the proportion of Croatians and percentage of population with cognitive disability in the United States with a correlation coefficient (R) of -0.145 and weighted average of 16.4%, a difference of 8.4%.
Cognitive Disability Correlation Summary
| Measurement | Mongolian | Croatian |
| Minimum | 0.74% | 4.2% |
| Maximum | 38.3% | 38.2% |
| Range | 37.6% | 34.0% |
| Mean | 16.1% | 15.8% |
| Median | 16.8% | 15.1% |
| Interquartile 25% (IQ1) | 12.6% | 13.5% |
| Interquartile 75% (IQ3) | 18.7% | 17.1% |
| Interquartile Range (IQR) | 6.1% | 3.6% |
| Standard Deviation (Sample) | 5.7% | 6.4% |
| Standard Deviation (Population) | 5.6% | 6.3% |
Similar Demographics by Cognitive Disability
Demographics Similar to Mongolians by Cognitive Disability
In terms of cognitive disability, the demographic groups most similar to Mongolians are Immigrants from Guatemala (17.7%, a difference of 0.020%), Guatemalan (17.8%, a difference of 0.030%), Tongan (17.8%, a difference of 0.030%), Panamanian (17.8%, a difference of 0.040%), and Immigrants from Central America (17.7%, a difference of 0.050%).
| Demographics | Rating | Rank | Cognitive Disability |
| Alsatians | 4.5 /100 | #223 | Tragic 17.7% |
| Fijians | 3.4 /100 | #224 | Tragic 17.7% |
| Vietnamese | 3.4 /100 | #225 | Tragic 17.7% |
| Marshallese | 2.7 /100 | #226 | Tragic 17.7% |
| Immigrants | St. Vincent and the Grenadines | 2.6 /100 | #227 | Tragic 17.7% |
| Immigrants | Central America | 2.3 /100 | #228 | Tragic 17.7% |
| Immigrants | Guatemala | 2.2 /100 | #229 | Tragic 17.7% |
| Mongolians | 2.2 /100 | #230 | Tragic 17.7% |
| Guatemalans | 2.1 /100 | #231 | Tragic 17.8% |
| Tongans | 2.1 /100 | #232 | Tragic 17.8% |
| Panamanians | 2.1 /100 | #233 | Tragic 17.8% |
| Osage | 2.0 /100 | #234 | Tragic 17.8% |
| Spanish American Indians | 2.0 /100 | #235 | Tragic 17.8% |
| Immigrants | Iraq | 1.8 /100 | #236 | Tragic 17.8% |
| Immigrants | Mexico | 1.8 /100 | #237 | Tragic 17.8% |
Demographics Similar to Croatians by Cognitive Disability
In terms of cognitive disability, the demographic groups most similar to Croatians are Immigrants from South Central Asia (16.4%, a difference of 0.030%), Immigrants from Argentina (16.4%, a difference of 0.030%), Luxembourger (16.4%, a difference of 0.060%), Immigrants from Croatia (16.4%, a difference of 0.10%), and Immigrants from Pakistan (16.4%, a difference of 0.12%).
| Demographics | Rating | Rank | Cognitive Disability |
| Eastern Europeans | 100.0 /100 | #16 | Exceptional 16.3% |
| Immigrants | North Macedonia | 100.0 /100 | #17 | Exceptional 16.3% |
| Immigrants | Northern Europe | 100.0 /100 | #18 | Exceptional 16.3% |
| Immigrants | Bolivia | 100.0 /100 | #19 | Exceptional 16.3% |
| Bulgarians | 100.0 /100 | #20 | Exceptional 16.3% |
| Immigrants | Cuba | 100.0 /100 | #21 | Exceptional 16.3% |
| Immigrants | South Central Asia | 99.9 /100 | #22 | Exceptional 16.4% |
| Croatians | 99.9 /100 | #23 | Exceptional 16.4% |
| Immigrants | Argentina | 99.9 /100 | #24 | Exceptional 16.4% |
| Luxembourgers | 99.9 /100 | #25 | Exceptional 16.4% |
| Immigrants | Croatia | 99.9 /100 | #26 | Exceptional 16.4% |
| Immigrants | Pakistan | 99.9 /100 | #27 | Exceptional 16.4% |
| Poles | 99.9 /100 | #28 | Exceptional 16.4% |
| Filipinos | 99.9 /100 | #29 | Exceptional 16.4% |
| Czechs | 99.9 /100 | #30 | Exceptional 16.4% |