Immigrants from Chile vs Arab Cognitive Disability
COMPARE
Immigrants from Chile
Arab
Cognitive Disability
Cognitive Disability Comparison
Immigrants from Chile
Arabs
17.0%
COGNITIVE DISABILITY
91.7/ 100
METRIC RATING
134th/ 347
METRIC RANK
17.3%
COGNITIVE DISABILITY
42.8/ 100
METRIC RATING
182nd/ 347
METRIC RANK
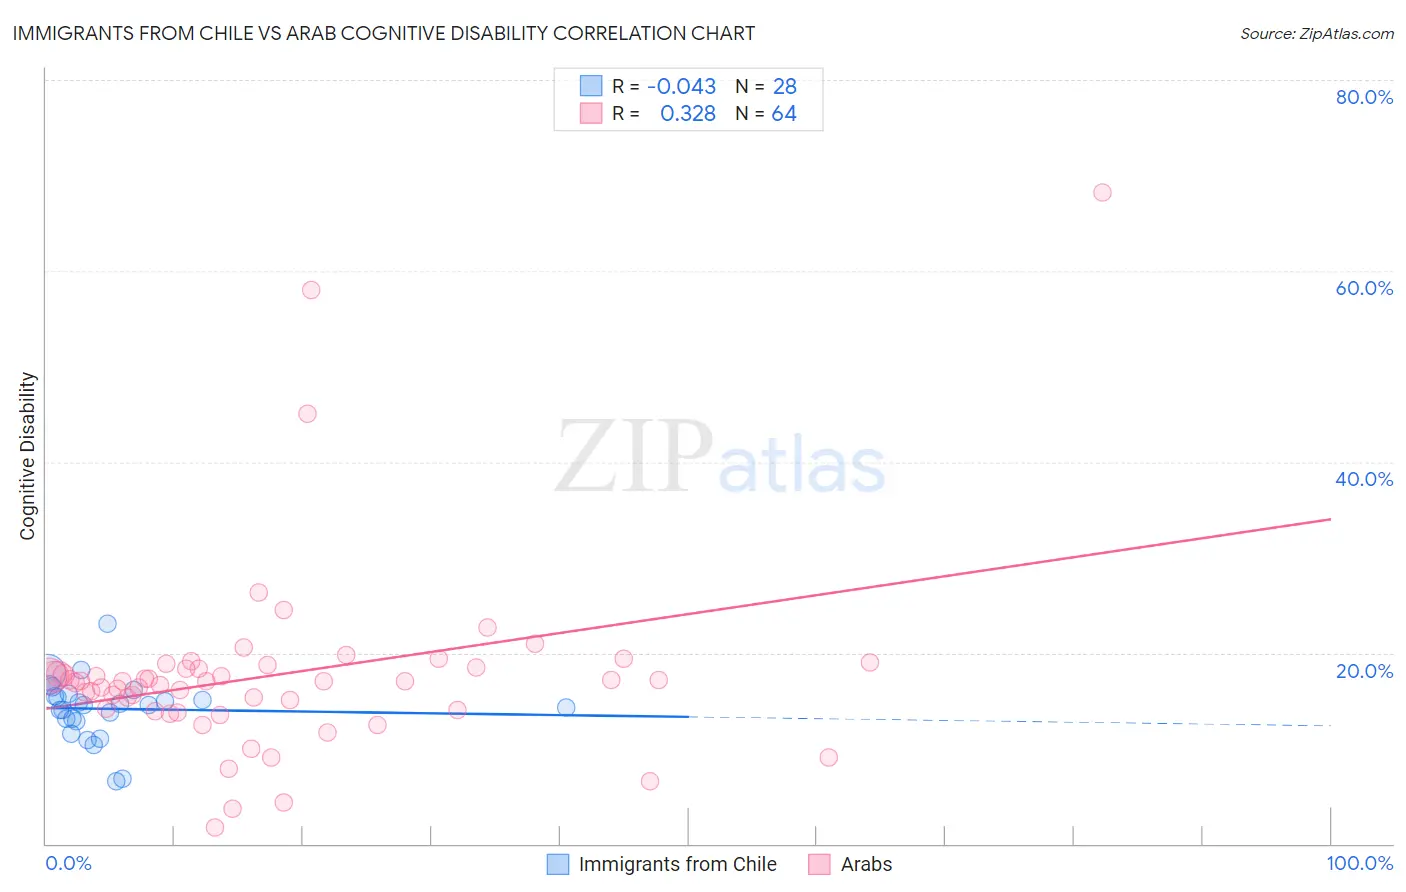
Immigrants from Chile vs Arab Cognitive Disability Correlation Chart
The statistical analysis conducted on geographies consisting of 218,627,878 people shows no correlation between the proportion of Immigrants from Chile and percentage of population with cognitive disability in the United States with a correlation coefficient (R) of -0.043 and weighted average of 17.0%. Similarly, the statistical analysis conducted on geographies consisting of 486,790,065 people shows a mild positive correlation between the proportion of Arabs and percentage of population with cognitive disability in the United States with a correlation coefficient (R) of 0.328 and weighted average of 17.3%, a difference of 1.9%.
Cognitive Disability Correlation Summary
| Measurement | Immigrants from Chile | Arab |
| Minimum | 6.5% | 1.6% |
| Maximum | 23.0% | 68.2% |
| Range | 16.5% | 66.6% |
| Mean | 14.1% | 17.7% |
| Median | 14.6% | 17.1% |
| Interquartile 25% (IQ1) | 13.0% | 14.1% |
| Interquartile 75% (IQ3) | 15.6% | 18.4% |
| Interquartile Range (IQR) | 2.6% | 4.3% |
| Standard Deviation (Sample) | 3.3% | 10.1% |
| Standard Deviation (Population) | 3.2% | 10.0% |
Similar Demographics by Cognitive Disability
Demographics Similar to Immigrants from Chile by Cognitive Disability
In terms of cognitive disability, the demographic groups most similar to Immigrants from Chile are Immigrants from Jordan (17.0%, a difference of 0.020%), Immigrants from Germany (17.0%, a difference of 0.040%), White/Caucasian (17.0%, a difference of 0.040%), Lebanese (17.0%, a difference of 0.040%), and Israeli (17.0%, a difference of 0.060%).
| Demographics | Rating | Rank | Cognitive Disability |
| Immigrants | Costa Rica | 93.1 /100 | #127 | Exceptional 17.0% |
| Nicaraguans | 93.0 /100 | #128 | Exceptional 17.0% |
| Immigrants | Uruguay | 92.9 /100 | #129 | Exceptional 17.0% |
| Immigrants | Vietnam | 92.4 /100 | #130 | Exceptional 17.0% |
| Immigrants | Germany | 92.1 /100 | #131 | Exceptional 17.0% |
| Whites/Caucasians | 92.1 /100 | #132 | Exceptional 17.0% |
| Immigrants | Jordan | 91.9 /100 | #133 | Exceptional 17.0% |
| Immigrants | Chile | 91.7 /100 | #134 | Exceptional 17.0% |
| Lebanese | 91.3 /100 | #135 | Exceptional 17.0% |
| Israelis | 91.0 /100 | #136 | Exceptional 17.0% |
| Immigrants | Norway | 90.9 /100 | #137 | Exceptional 17.0% |
| Welsh | 90.8 /100 | #138 | Exceptional 17.0% |
| French | 90.0 /100 | #139 | Excellent 17.0% |
| Chileans | 89.9 /100 | #140 | Excellent 17.0% |
| Aleuts | 89.9 /100 | #141 | Excellent 17.0% |
Demographics Similar to Arabs by Cognitive Disability
In terms of cognitive disability, the demographic groups most similar to Arabs are Immigrants from Guyana (17.3%, a difference of 0.0%), Pakistani (17.3%, a difference of 0.030%), Spaniard (17.3%, a difference of 0.070%), Crow (17.3%, a difference of 0.11%), and Afghan (17.3%, a difference of 0.14%).
| Demographics | Rating | Rank | Cognitive Disability |
| Tsimshian | 49.8 /100 | #175 | Average 17.3% |
| Shoshone | 49.2 /100 | #176 | Average 17.3% |
| Ute | 49.1 /100 | #177 | Average 17.3% |
| Spanish | 48.9 /100 | #178 | Average 17.3% |
| Sioux | 48.6 /100 | #179 | Average 17.3% |
| Pakistanis | 43.9 /100 | #180 | Average 17.3% |
| Immigrants | Guyana | 42.9 /100 | #181 | Average 17.3% |
| Arabs | 42.8 /100 | #182 | Average 17.3% |
| Spaniards | 40.3 /100 | #183 | Average 17.3% |
| Crow | 39.1 /100 | #184 | Fair 17.3% |
| Afghans | 38.2 /100 | #185 | Fair 17.3% |
| Cambodians | 35.9 /100 | #186 | Fair 17.3% |
| Immigrants | Fiji | 33.7 /100 | #187 | Fair 17.4% |
| Immigrants | France | 29.8 /100 | #188 | Fair 17.4% |
| Immigrants | Western Asia | 29.5 /100 | #189 | Fair 17.4% |