Mongolian vs Celtic Cognitive Disability
COMPARE
Mongolian
Celtic
Cognitive Disability
Cognitive Disability Comparison
Mongolians
Celtics
17.7%
COGNITIVE DISABILITY
2.2/ 100
METRIC RATING
230th/ 347
METRIC RANK
17.1%
COGNITIVE DISABILITY
74.1/ 100
METRIC RATING
158th/ 347
METRIC RANK
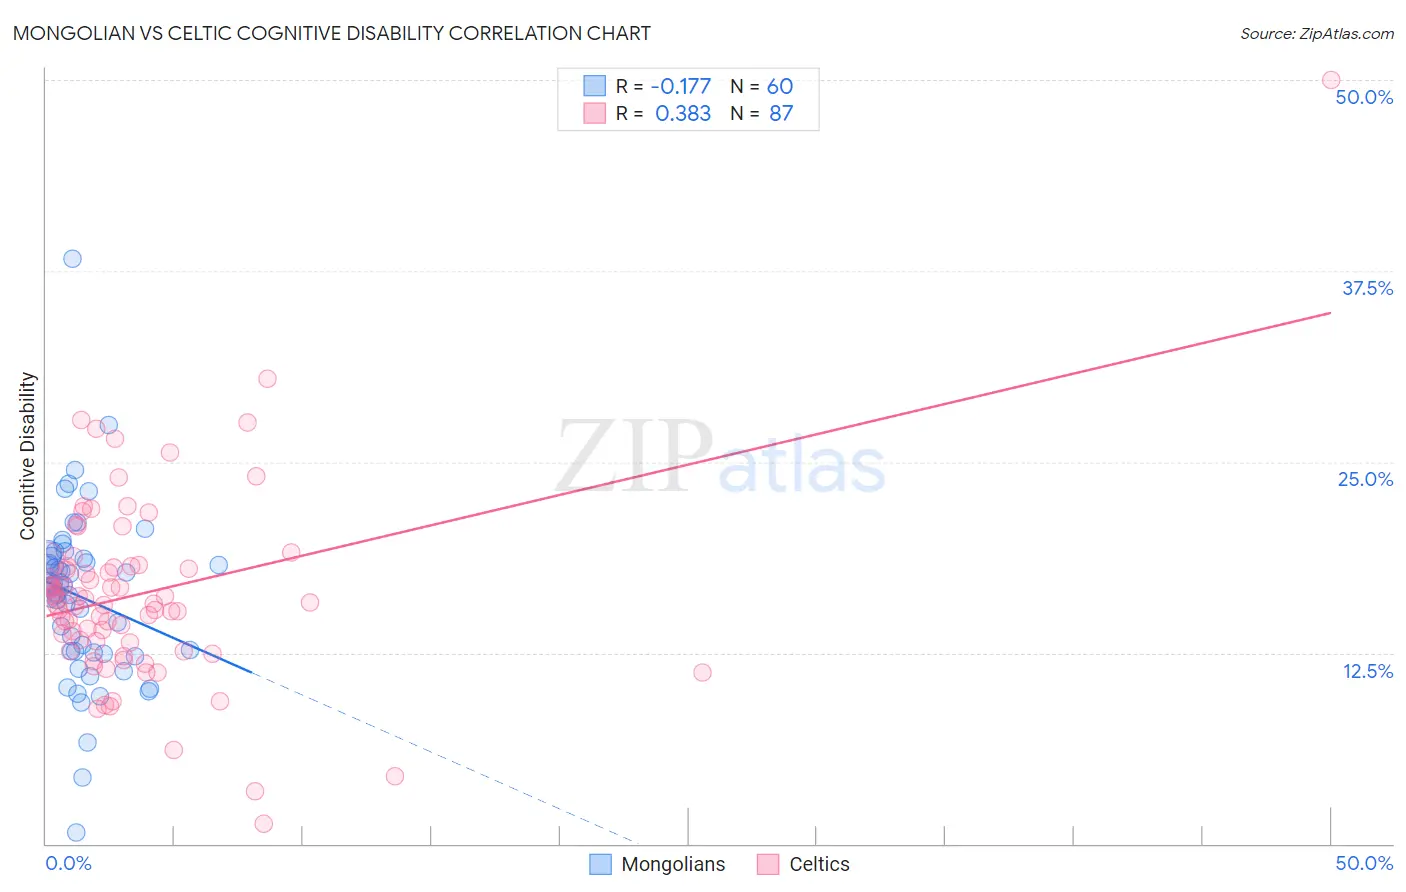
Mongolian vs Celtic Cognitive Disability Correlation Chart
The statistical analysis conducted on geographies consisting of 140,359,372 people shows a poor negative correlation between the proportion of Mongolians and percentage of population with cognitive disability in the United States with a correlation coefficient (R) of -0.177 and weighted average of 17.7%. Similarly, the statistical analysis conducted on geographies consisting of 168,858,493 people shows a mild positive correlation between the proportion of Celtics and percentage of population with cognitive disability in the United States with a correlation coefficient (R) of 0.383 and weighted average of 17.1%, a difference of 3.5%.
Cognitive Disability Correlation Summary
| Measurement | Mongolian | Celtic |
| Minimum | 0.74% | 1.3% |
| Maximum | 38.3% | 50.0% |
| Range | 37.6% | 48.7% |
| Mean | 16.1% | 16.4% |
| Median | 16.8% | 15.8% |
| Interquartile 25% (IQ1) | 12.6% | 13.2% |
| Interquartile 75% (IQ3) | 18.7% | 18.2% |
| Interquartile Range (IQR) | 6.1% | 5.0% |
| Standard Deviation (Sample) | 5.7% | 6.4% |
| Standard Deviation (Population) | 5.6% | 6.3% |
Similar Demographics by Cognitive Disability
Demographics Similar to Mongolians by Cognitive Disability
In terms of cognitive disability, the demographic groups most similar to Mongolians are Immigrants from Guatemala (17.7%, a difference of 0.020%), Guatemalan (17.8%, a difference of 0.030%), Tongan (17.8%, a difference of 0.030%), Panamanian (17.8%, a difference of 0.040%), and Immigrants from Central America (17.7%, a difference of 0.050%).
| Demographics | Rating | Rank | Cognitive Disability |
| Alsatians | 4.5 /100 | #223 | Tragic 17.7% |
| Fijians | 3.4 /100 | #224 | Tragic 17.7% |
| Vietnamese | 3.4 /100 | #225 | Tragic 17.7% |
| Marshallese | 2.7 /100 | #226 | Tragic 17.7% |
| Immigrants | St. Vincent and the Grenadines | 2.6 /100 | #227 | Tragic 17.7% |
| Immigrants | Central America | 2.3 /100 | #228 | Tragic 17.7% |
| Immigrants | Guatemala | 2.2 /100 | #229 | Tragic 17.7% |
| Mongolians | 2.2 /100 | #230 | Tragic 17.7% |
| Guatemalans | 2.1 /100 | #231 | Tragic 17.8% |
| Tongans | 2.1 /100 | #232 | Tragic 17.8% |
| Panamanians | 2.1 /100 | #233 | Tragic 17.8% |
| Osage | 2.0 /100 | #234 | Tragic 17.8% |
| Spanish American Indians | 2.0 /100 | #235 | Tragic 17.8% |
| Immigrants | Iraq | 1.8 /100 | #236 | Tragic 17.8% |
| Immigrants | Mexico | 1.8 /100 | #237 | Tragic 17.8% |
Demographics Similar to Celtics by Cognitive Disability
In terms of cognitive disability, the demographic groups most similar to Celtics are Immigrants from Latvia (17.2%, a difference of 0.030%), Australian (17.2%, a difference of 0.060%), Immigrants from Australia (17.1%, a difference of 0.070%), American (17.2%, a difference of 0.070%), and Yugoslavian (17.2%, a difference of 0.090%).
| Demographics | Rating | Rank | Cognitive Disability |
| Syrians | 83.0 /100 | #151 | Excellent 17.1% |
| Immigrants | Indonesia | 82.7 /100 | #152 | Excellent 17.1% |
| Immigrants | Kazakhstan | 80.5 /100 | #153 | Excellent 17.1% |
| Immigrants | Malaysia | 79.3 /100 | #154 | Good 17.1% |
| Brazilians | 78.9 /100 | #155 | Good 17.1% |
| Sri Lankans | 78.9 /100 | #156 | Good 17.1% |
| Immigrants | Australia | 76.0 /100 | #157 | Good 17.1% |
| Celtics | 74.1 /100 | #158 | Good 17.1% |
| Immigrants | Latvia | 73.2 /100 | #159 | Good 17.2% |
| Australians | 72.4 /100 | #160 | Good 17.2% |
| Americans | 72.2 /100 | #161 | Good 17.2% |
| Yugoslavians | 71.6 /100 | #162 | Good 17.2% |
| Immigrants | Switzerland | 71.5 /100 | #163 | Good 17.2% |
| Armenians | 70.1 /100 | #164 | Good 17.2% |
| Immigrants | Albania | 64.9 /100 | #165 | Good 17.2% |