Mongolian vs Immigrants from Netherlands Cognitive Disability
COMPARE
Mongolian
Immigrants from Netherlands
Cognitive Disability
Cognitive Disability Comparison
Mongolians
Immigrants from Netherlands
17.7%
COGNITIVE DISABILITY
2.2/ 100
METRIC RATING
230th/ 347
METRIC RANK
16.7%
COGNITIVE DISABILITY
99.2/ 100
METRIC RATING
81st/ 347
METRIC RANK
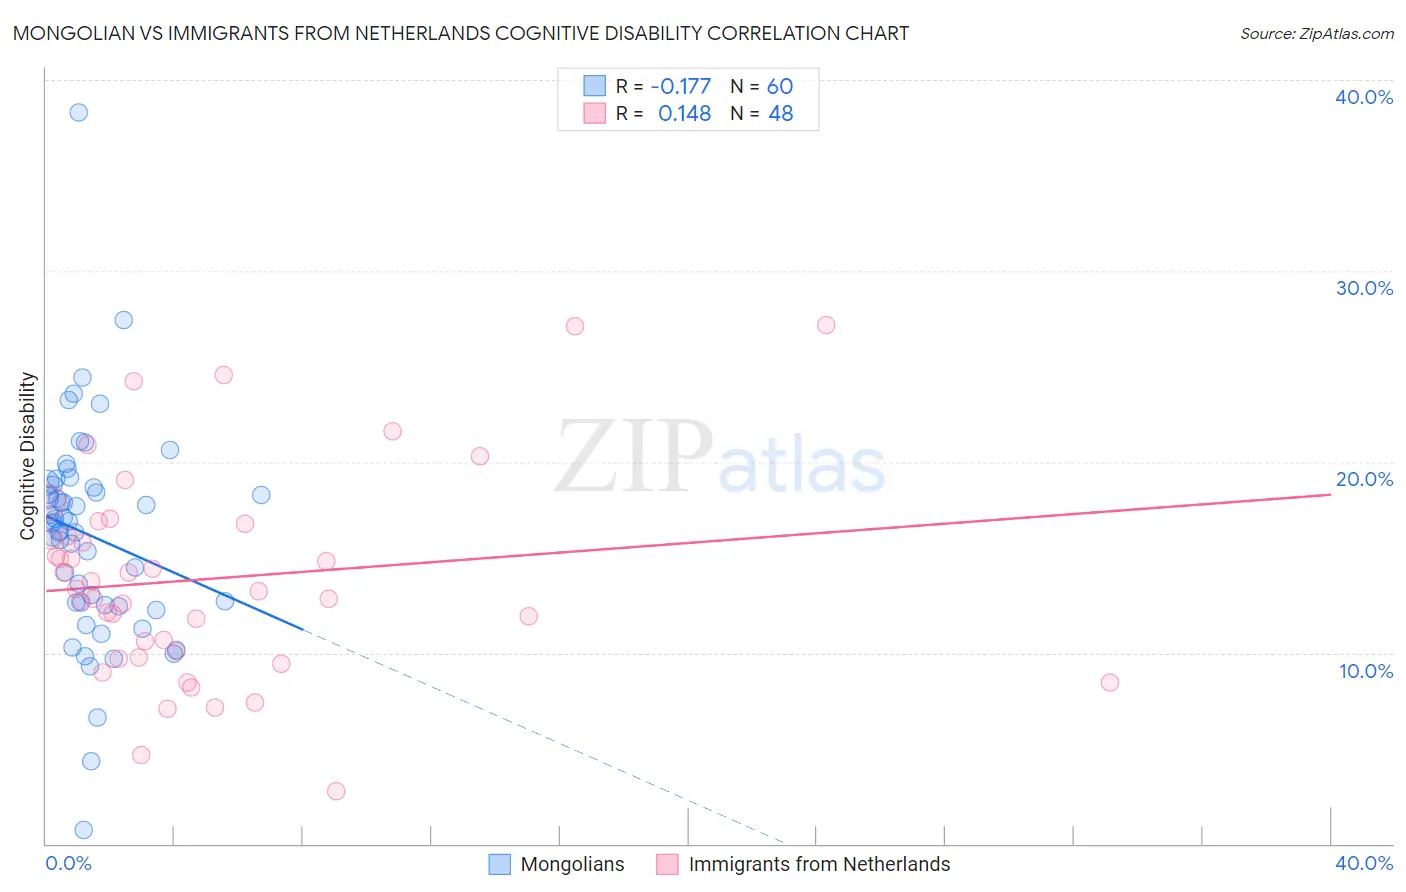
Mongolian vs Immigrants from Netherlands Cognitive Disability Correlation Chart
The statistical analysis conducted on geographies consisting of 140,359,372 people shows a poor negative correlation between the proportion of Mongolians and percentage of population with cognitive disability in the United States with a correlation coefficient (R) of -0.177 and weighted average of 17.7%. Similarly, the statistical analysis conducted on geographies consisting of 237,879,934 people shows a poor positive correlation between the proportion of Immigrants from Netherlands and percentage of population with cognitive disability in the United States with a correlation coefficient (R) of 0.148 and weighted average of 16.7%, a difference of 6.4%.
Cognitive Disability Correlation Summary
| Measurement | Mongolian | Immigrants from Netherlands |
| Minimum | 0.74% | 2.7% |
| Maximum | 38.3% | 27.2% |
| Range | 37.6% | 24.4% |
| Mean | 16.1% | 13.9% |
| Median | 16.8% | 13.3% |
| Interquartile 25% (IQ1) | 12.6% | 9.9% |
| Interquartile 75% (IQ3) | 18.7% | 16.5% |
| Interquartile Range (IQR) | 6.1% | 6.6% |
| Standard Deviation (Sample) | 5.7% | 5.4% |
| Standard Deviation (Population) | 5.6% | 5.4% |
Similar Demographics by Cognitive Disability
Demographics Similar to Mongolians by Cognitive Disability
In terms of cognitive disability, the demographic groups most similar to Mongolians are Immigrants from Guatemala (17.7%, a difference of 0.020%), Guatemalan (17.8%, a difference of 0.030%), Tongan (17.8%, a difference of 0.030%), Panamanian (17.8%, a difference of 0.040%), and Immigrants from Central America (17.7%, a difference of 0.050%).
| Demographics | Rating | Rank | Cognitive Disability |
| Alsatians | 4.5 /100 | #223 | Tragic 17.7% |
| Fijians | 3.4 /100 | #224 | Tragic 17.7% |
| Vietnamese | 3.4 /100 | #225 | Tragic 17.7% |
| Marshallese | 2.7 /100 | #226 | Tragic 17.7% |
| Immigrants | St. Vincent and the Grenadines | 2.6 /100 | #227 | Tragic 17.7% |
| Immigrants | Central America | 2.3 /100 | #228 | Tragic 17.7% |
| Immigrants | Guatemala | 2.2 /100 | #229 | Tragic 17.7% |
| Mongolians | 2.2 /100 | #230 | Tragic 17.7% |
| Guatemalans | 2.1 /100 | #231 | Tragic 17.8% |
| Tongans | 2.1 /100 | #232 | Tragic 17.8% |
| Panamanians | 2.1 /100 | #233 | Tragic 17.8% |
| Osage | 2.0 /100 | #234 | Tragic 17.8% |
| Spanish American Indians | 2.0 /100 | #235 | Tragic 17.8% |
| Immigrants | Iraq | 1.8 /100 | #236 | Tragic 17.8% |
| Immigrants | Mexico | 1.8 /100 | #237 | Tragic 17.8% |
Demographics Similar to Immigrants from Netherlands by Cognitive Disability
In terms of cognitive disability, the demographic groups most similar to Immigrants from Netherlands are Egyptian (16.7%, a difference of 0.010%), Swiss (16.7%, a difference of 0.030%), Peruvian (16.7%, a difference of 0.040%), Immigrants from Bulgaria (16.7%, a difference of 0.040%), and Immigrants from Hungary (16.7%, a difference of 0.050%).
| Demographics | Rating | Rank | Cognitive Disability |
| Slavs | 99.3 /100 | #74 | Exceptional 16.7% |
| Estonians | 99.3 /100 | #75 | Exceptional 16.7% |
| Immigrants | Serbia | 99.3 /100 | #76 | Exceptional 16.7% |
| Immigrants | Hungary | 99.3 /100 | #77 | Exceptional 16.7% |
| Peruvians | 99.3 /100 | #78 | Exceptional 16.7% |
| Immigrants | Bulgaria | 99.3 /100 | #79 | Exceptional 16.7% |
| Egyptians | 99.2 /100 | #80 | Exceptional 16.7% |
| Immigrants | Netherlands | 99.2 /100 | #81 | Exceptional 16.7% |
| Swiss | 99.2 /100 | #82 | Exceptional 16.7% |
| Serbians | 99.1 /100 | #83 | Exceptional 16.7% |
| Belgians | 99.1 /100 | #84 | Exceptional 16.7% |
| Immigrants | Moldova | 99.1 /100 | #85 | Exceptional 16.7% |
| Immigrants | South Africa | 99.0 /100 | #86 | Exceptional 16.7% |
| Native Hawaiians | 99.0 /100 | #87 | Exceptional 16.7% |
| Immigrants | Philippines | 99.0 /100 | #88 | Exceptional 16.7% |