Mongolian vs Arab Single Father Households
COMPARE
Mongolian
Arab
Single Father Households
Single Father Households Comparison
Mongolians
Arabs
2.1%
SINGLE FATHER HOUSEHOLDS
99.9/ 100
METRIC RATING
64th/ 347
METRIC RANK
2.1%
SINGLE FATHER HOUSEHOLDS
99.2/ 100
METRIC RATING
96th/ 347
METRIC RANK
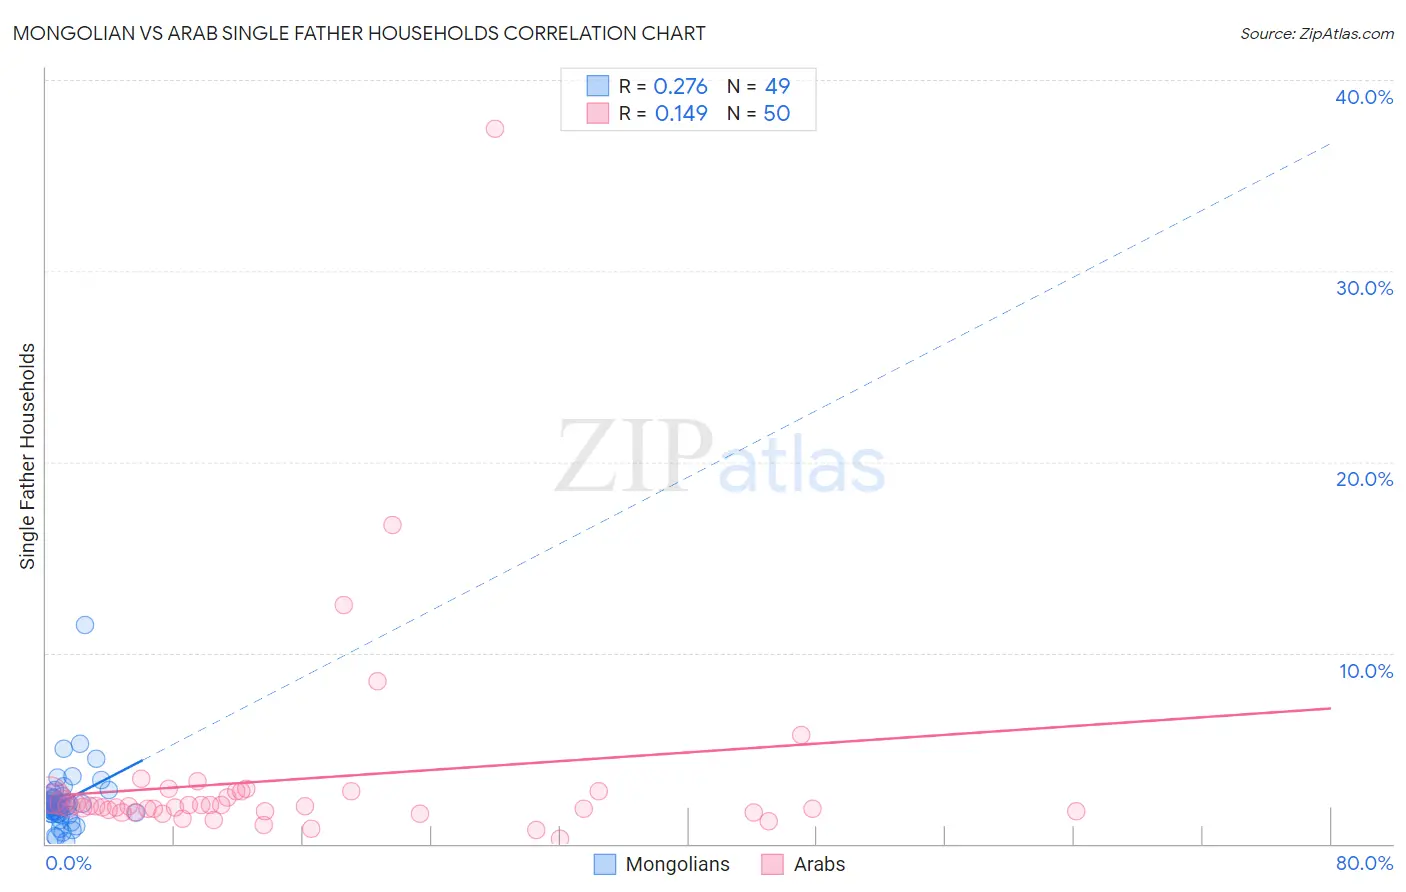
Mongolian vs Arab Single Father Households Correlation Chart
The statistical analysis conducted on geographies consisting of 139,899,645 people shows a weak positive correlation between the proportion of Mongolians and percentage of single father households in the United States with a correlation coefficient (R) of 0.276 and weighted average of 2.1%. Similarly, the statistical analysis conducted on geographies consisting of 480,579,440 people shows a poor positive correlation between the proportion of Arabs and percentage of single father households in the United States with a correlation coefficient (R) of 0.149 and weighted average of 2.1%, a difference of 3.9%.
Single Father Households Correlation Summary
| Measurement | Mongolian | Arab |
| Minimum | 0.15% | 0.25% |
| Maximum | 11.5% | 37.5% |
| Range | 11.3% | 37.2% |
| Mean | 2.2% | 3.4% |
| Median | 2.0% | 2.0% |
| Interquartile 25% (IQ1) | 1.6% | 1.7% |
| Interquartile 75% (IQ3) | 2.5% | 2.7% |
| Interquartile Range (IQR) | 0.91% | 1.0% |
| Standard Deviation (Sample) | 1.7% | 5.6% |
| Standard Deviation (Population) | 1.7% | 5.6% |
Similar Demographics by Single Father Households
Demographics Similar to Mongolians by Single Father Households
In terms of single father households, the demographic groups most similar to Mongolians are Paraguayan (2.1%, a difference of 0.030%), Maltese (2.0%, a difference of 0.14%), Immigrants from Malaysia (2.0%, a difference of 0.34%), Immigrants from Western Asia (2.1%, a difference of 0.39%), and Immigrants from Italy (2.1%, a difference of 0.43%).
| Demographics | Rating | Rank | Single Father Households |
| Burmese | 99.9 /100 | #57 | Exceptional 2.0% |
| Immigrants | Czechoslovakia | 99.9 /100 | #58 | Exceptional 2.0% |
| Immigrants | North Macedonia | 99.9 /100 | #59 | Exceptional 2.0% |
| Immigrants | Austria | 99.9 /100 | #60 | Exceptional 2.0% |
| Vietnamese | 99.9 /100 | #61 | Exceptional 2.0% |
| Immigrants | Malaysia | 99.9 /100 | #62 | Exceptional 2.0% |
| Maltese | 99.9 /100 | #63 | Exceptional 2.0% |
| Mongolians | 99.9 /100 | #64 | Exceptional 2.1% |
| Paraguayans | 99.9 /100 | #65 | Exceptional 2.1% |
| Immigrants | Western Asia | 99.8 /100 | #66 | Exceptional 2.1% |
| Immigrants | Italy | 99.8 /100 | #67 | Exceptional 2.1% |
| Immigrants | Denmark | 99.8 /100 | #68 | Exceptional 2.1% |
| Immigrants | Romania | 99.8 /100 | #69 | Exceptional 2.1% |
| Egyptians | 99.8 /100 | #70 | Exceptional 2.1% |
| Immigrants | Kuwait | 99.8 /100 | #71 | Exceptional 2.1% |
Demographics Similar to Arabs by Single Father Households
In terms of single father households, the demographic groups most similar to Arabs are Immigrants from Moldova (2.1%, a difference of 0.13%), Bermudan (2.1%, a difference of 0.14%), Guyanese (2.1%, a difference of 0.25%), South African (2.1%, a difference of 0.30%), and Croatian (2.1%, a difference of 0.37%).
| Demographics | Rating | Rank | Single Father Households |
| Immigrants | Armenia | 99.5 /100 | #89 | Exceptional 2.1% |
| Immigrants | Pakistan | 99.5 /100 | #90 | Exceptional 2.1% |
| Immigrants | Guyana | 99.4 /100 | #91 | Exceptional 2.1% |
| Romanians | 99.4 /100 | #92 | Exceptional 2.1% |
| Croatians | 99.3 /100 | #93 | Exceptional 2.1% |
| Ukrainians | 99.3 /100 | #94 | Exceptional 2.1% |
| Bermudans | 99.2 /100 | #95 | Exceptional 2.1% |
| Arabs | 99.2 /100 | #96 | Exceptional 2.1% |
| Immigrants | Moldova | 99.1 /100 | #97 | Exceptional 2.1% |
| Guyanese | 99.1 /100 | #98 | Exceptional 2.1% |
| South Africans | 99.1 /100 | #99 | Exceptional 2.1% |
| Immigrants | Northern Africa | 99.0 /100 | #100 | Exceptional 2.1% |
| Immigrants | Western Europe | 98.9 /100 | #101 | Exceptional 2.1% |
| Argentineans | 98.9 /100 | #102 | Exceptional 2.1% |
| Lebanese | 98.9 /100 | #103 | Exceptional 2.1% |