Greek vs Arab Cognitive Disability
COMPARE
Greek
Arab
Cognitive Disability
Cognitive Disability Comparison
Greeks
Arabs
16.4%
COGNITIVE DISABILITY
99.9/ 100
METRIC RATING
36th/ 347
METRIC RANK
17.3%
COGNITIVE DISABILITY
42.8/ 100
METRIC RATING
182nd/ 347
METRIC RANK
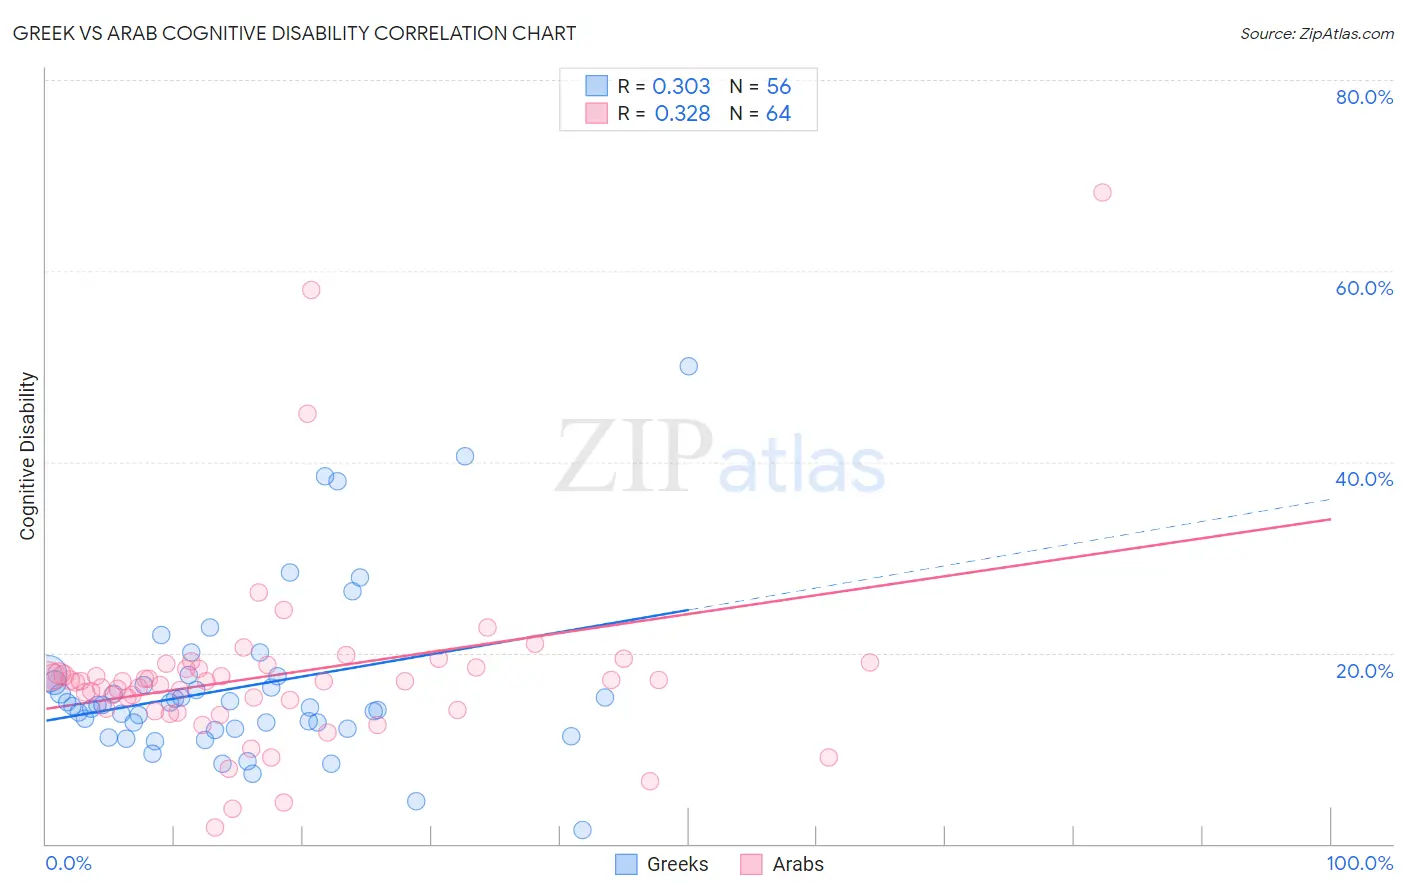
Greek vs Arab Cognitive Disability Correlation Chart
The statistical analysis conducted on geographies consisting of 482,712,046 people shows a mild positive correlation between the proportion of Greeks and percentage of population with cognitive disability in the United States with a correlation coefficient (R) of 0.303 and weighted average of 16.4%. Similarly, the statistical analysis conducted on geographies consisting of 486,790,065 people shows a mild positive correlation between the proportion of Arabs and percentage of population with cognitive disability in the United States with a correlation coefficient (R) of 0.328 and weighted average of 17.3%, a difference of 5.4%.
Cognitive Disability Correlation Summary
| Measurement | Greek | Arab |
| Minimum | 1.5% | 1.6% |
| Maximum | 50.0% | 68.2% |
| Range | 48.5% | 66.6% |
| Mean | 16.4% | 17.7% |
| Median | 14.4% | 17.1% |
| Interquartile 25% (IQ1) | 12.0% | 14.1% |
| Interquartile 75% (IQ3) | 17.2% | 18.4% |
| Interquartile Range (IQR) | 5.2% | 4.3% |
| Standard Deviation (Sample) | 8.7% | 10.1% |
| Standard Deviation (Population) | 8.6% | 10.0% |
Similar Demographics by Cognitive Disability
Demographics Similar to Greeks by Cognitive Disability
In terms of cognitive disability, the demographic groups most similar to Greeks are Slovak (16.4%, a difference of 0.010%), Italian (16.4%, a difference of 0.090%), Russian (16.4%, a difference of 0.090%), Slovene (16.5%, a difference of 0.15%), and Immigrants from Israel (16.4%, a difference of 0.16%).
| Demographics | Rating | Rank | Cognitive Disability |
| Filipinos | 99.9 /100 | #29 | Exceptional 16.4% |
| Czechs | 99.9 /100 | #30 | Exceptional 16.4% |
| Immigrants | Romania | 99.9 /100 | #31 | Exceptional 16.4% |
| Immigrants | Israel | 99.9 /100 | #32 | Exceptional 16.4% |
| Italians | 99.9 /100 | #33 | Exceptional 16.4% |
| Russians | 99.9 /100 | #34 | Exceptional 16.4% |
| Slovaks | 99.9 /100 | #35 | Exceptional 16.4% |
| Greeks | 99.9 /100 | #36 | Exceptional 16.4% |
| Slovenes | 99.9 /100 | #37 | Exceptional 16.5% |
| Immigrants | Eastern Europe | 99.9 /100 | #38 | Exceptional 16.5% |
| Bolivians | 99.9 /100 | #39 | Exceptional 16.5% |
| Immigrants | Belarus | 99.9 /100 | #40 | Exceptional 16.5% |
| Cubans | 99.9 /100 | #41 | Exceptional 16.5% |
| Hungarians | 99.9 /100 | #42 | Exceptional 16.5% |
| Immigrants | Canada | 99.8 /100 | #43 | Exceptional 16.5% |
Demographics Similar to Arabs by Cognitive Disability
In terms of cognitive disability, the demographic groups most similar to Arabs are Immigrants from Guyana (17.3%, a difference of 0.0%), Pakistani (17.3%, a difference of 0.030%), Spaniard (17.3%, a difference of 0.070%), Crow (17.3%, a difference of 0.11%), and Afghan (17.3%, a difference of 0.14%).
| Demographics | Rating | Rank | Cognitive Disability |
| Tsimshian | 49.8 /100 | #175 | Average 17.3% |
| Shoshone | 49.2 /100 | #176 | Average 17.3% |
| Ute | 49.1 /100 | #177 | Average 17.3% |
| Spanish | 48.9 /100 | #178 | Average 17.3% |
| Sioux | 48.6 /100 | #179 | Average 17.3% |
| Pakistanis | 43.9 /100 | #180 | Average 17.3% |
| Immigrants | Guyana | 42.9 /100 | #181 | Average 17.3% |
| Arabs | 42.8 /100 | #182 | Average 17.3% |
| Spaniards | 40.3 /100 | #183 | Average 17.3% |
| Crow | 39.1 /100 | #184 | Fair 17.3% |
| Afghans | 38.2 /100 | #185 | Fair 17.3% |
| Cambodians | 35.9 /100 | #186 | Fair 17.3% |
| Immigrants | Fiji | 33.7 /100 | #187 | Fair 17.4% |
| Immigrants | France | 29.8 /100 | #188 | Fair 17.4% |
| Immigrants | Western Asia | 29.5 /100 | #189 | Fair 17.4% |