Immigrants from Syria vs Arab Cognitive Disability
COMPARE
Immigrants from Syria
Arab
Cognitive Disability
Cognitive Disability Comparison
Immigrants from Syria
Arabs
17.2%
COGNITIVE DISABILITY
63.5/ 100
METRIC RATING
167th/ 347
METRIC RANK
17.3%
COGNITIVE DISABILITY
42.8/ 100
METRIC RATING
182nd/ 347
METRIC RANK
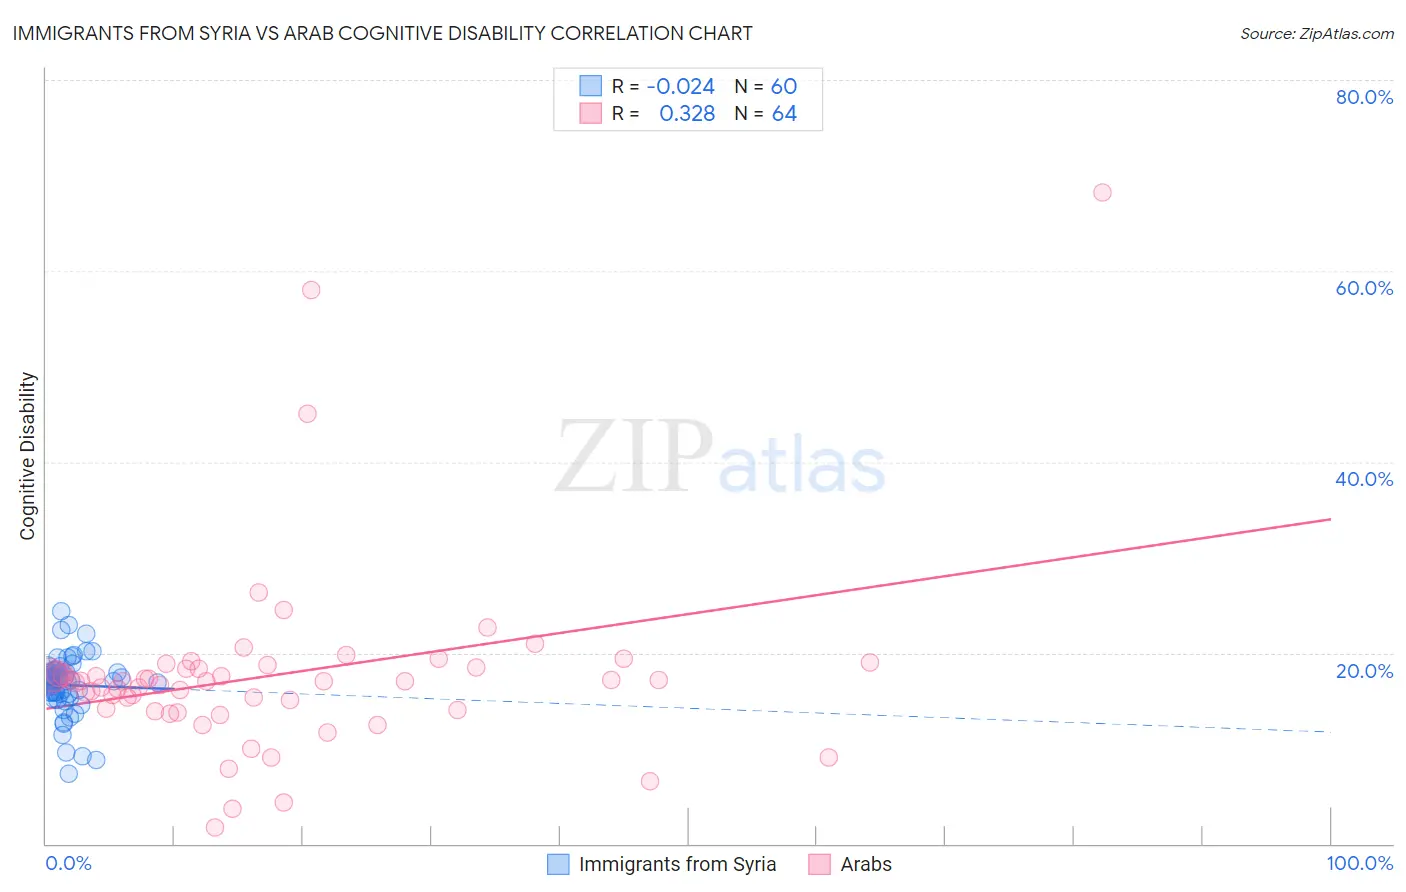
Immigrants from Syria vs Arab Cognitive Disability Correlation Chart
The statistical analysis conducted on geographies consisting of 174,112,347 people shows no correlation between the proportion of Immigrants from Syria and percentage of population with cognitive disability in the United States with a correlation coefficient (R) of -0.024 and weighted average of 17.2%. Similarly, the statistical analysis conducted on geographies consisting of 486,790,065 people shows a mild positive correlation between the proportion of Arabs and percentage of population with cognitive disability in the United States with a correlation coefficient (R) of 0.328 and weighted average of 17.3%, a difference of 0.60%.
Cognitive Disability Correlation Summary
| Measurement | Immigrants from Syria | Arab |
| Minimum | 7.4% | 1.6% |
| Maximum | 24.4% | 68.2% |
| Range | 17.0% | 66.6% |
| Mean | 16.6% | 17.7% |
| Median | 17.1% | 17.1% |
| Interquartile 25% (IQ1) | 15.5% | 14.1% |
| Interquartile 75% (IQ3) | 18.2% | 18.4% |
| Interquartile Range (IQR) | 2.7% | 4.3% |
| Standard Deviation (Sample) | 3.2% | 10.1% |
| Standard Deviation (Population) | 3.2% | 10.0% |
Demographics Similar to Immigrants from Syria and Arabs by Cognitive Disability
In terms of cognitive disability, the demographic groups most similar to Immigrants from Syria are Immigrants from Ecuador (17.2%, a difference of 0.030%), Immigrants (17.2%, a difference of 0.030%), Immigrants from Albania (17.2%, a difference of 0.040%), Immigrants from Portugal (17.2%, a difference of 0.050%), and Ecuadorian (17.2%, a difference of 0.12%). Similarly, the demographic groups most similar to Arabs are Immigrants from Guyana (17.3%, a difference of 0.0%), Pakistani (17.3%, a difference of 0.030%), Spaniard (17.3%, a difference of 0.070%), Crow (17.3%, a difference of 0.11%), and Sioux (17.3%, a difference of 0.17%).
| Demographics | Rating | Rank | Cognitive Disability |
| Armenians | 70.1 /100 | #164 | Good 17.2% |
| Immigrants | Albania | 64.9 /100 | #165 | Good 17.2% |
| Immigrants | Ecuador | 64.4 /100 | #166 | Good 17.2% |
| Immigrants | Syria | 63.5 /100 | #167 | Good 17.2% |
| Immigrants | Immigrants | 62.5 /100 | #168 | Good 17.2% |
| Immigrants | Portugal | 61.8 /100 | #169 | Good 17.2% |
| Ecuadorians | 59.6 /100 | #170 | Average 17.2% |
| Tlingit-Haida | 59.4 /100 | #171 | Average 17.2% |
| Immigrants | Turkey | 56.7 /100 | #172 | Average 17.2% |
| Immigrants | Northern Africa | 50.2 /100 | #173 | Average 17.3% |
| Laotians | 50.0 /100 | #174 | Average 17.3% |
| Tsimshian | 49.8 /100 | #175 | Average 17.3% |
| Shoshone | 49.2 /100 | #176 | Average 17.3% |
| Ute | 49.1 /100 | #177 | Average 17.3% |
| Spanish | 48.9 /100 | #178 | Average 17.3% |
| Sioux | 48.6 /100 | #179 | Average 17.3% |
| Pakistanis | 43.9 /100 | #180 | Average 17.3% |
| Immigrants | Guyana | 42.9 /100 | #181 | Average 17.3% |
| Arabs | 42.8 /100 | #182 | Average 17.3% |
| Spaniards | 40.3 /100 | #183 | Average 17.3% |
| Crow | 39.1 /100 | #184 | Fair 17.3% |