Immigrants from Yemen vs French Canadian Disability Age 5 to 17
COMPARE
Immigrants from Yemen
French Canadian
Disability Age 5 to 17
Disability Age 5 to 17 Comparison
Immigrants from Yemen
French Canadians
5.3%
DISABILITY AGE 5 TO 17
98.2/ 100
METRIC RATING
106th/ 347
METRIC RANK
6.7%
DISABILITY AGE 5 TO 17
0.0/ 100
METRIC RATING
331st/ 347
METRIC RANK
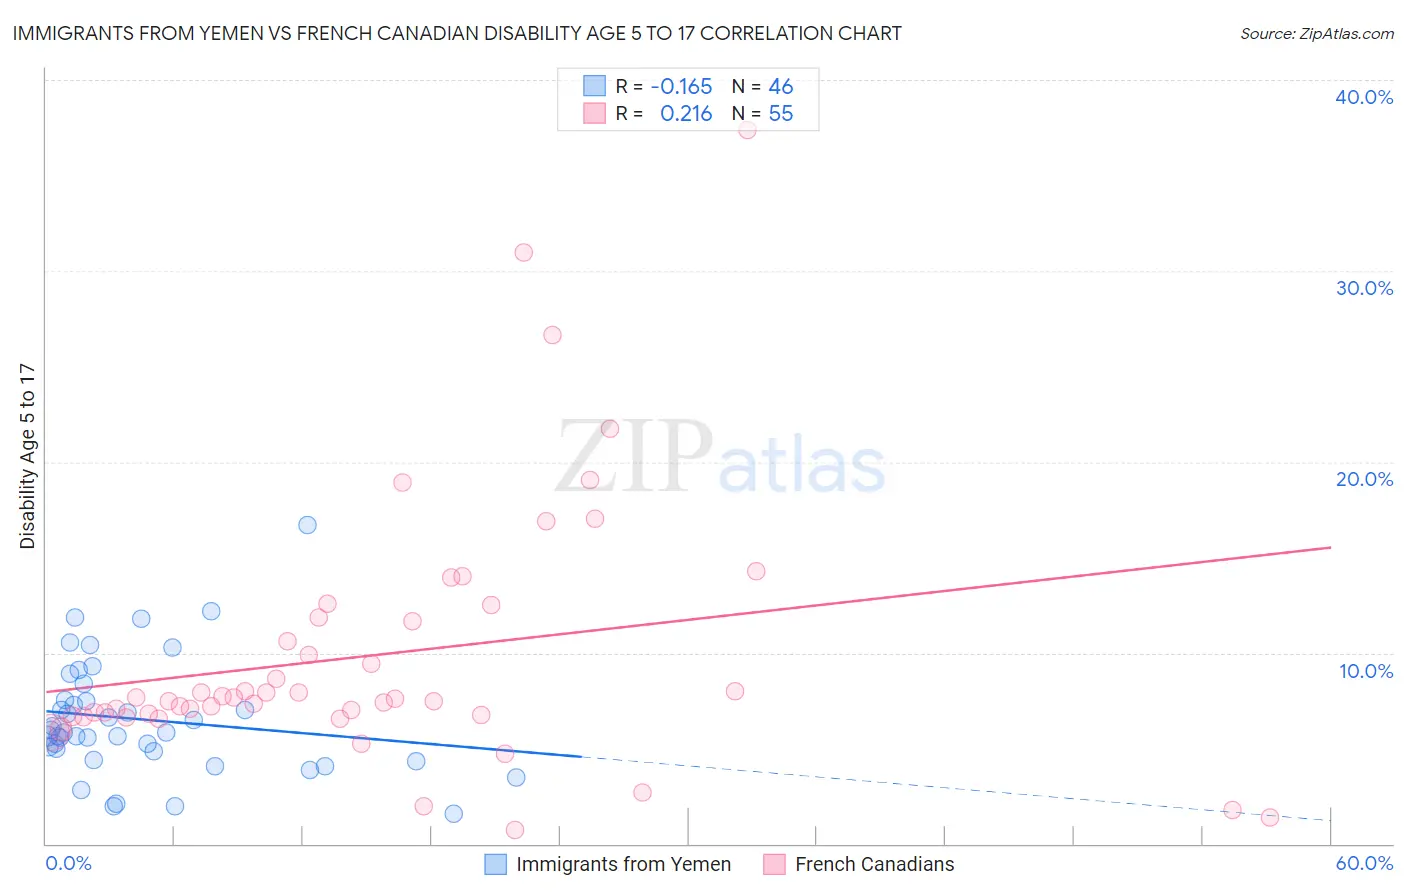
Immigrants from Yemen vs French Canadian Disability Age 5 to 17 Correlation Chart
The statistical analysis conducted on geographies consisting of 82,306,406 people shows a poor negative correlation between the proportion of Immigrants from Yemen and percentage of population with a disability between the ages 5 and 17 in the United States with a correlation coefficient (R) of -0.165 and weighted average of 5.3%. Similarly, the statistical analysis conducted on geographies consisting of 494,798,155 people shows a weak positive correlation between the proportion of French Canadians and percentage of population with a disability between the ages 5 and 17 in the United States with a correlation coefficient (R) of 0.216 and weighted average of 6.7%, a difference of 26.1%.
Disability Age 5 to 17 Correlation Summary
| Measurement | Immigrants from Yemen | French Canadian |
| Minimum | 1.6% | 0.75% |
| Maximum | 16.7% | 37.4% |
| Range | 15.1% | 36.6% |
| Mean | 6.5% | 9.9% |
| Median | 5.8% | 7.6% |
| Interquartile 25% (IQ1) | 4.8% | 6.7% |
| Interquartile 75% (IQ3) | 7.5% | 11.8% |
| Interquartile Range (IQR) | 2.7% | 5.2% |
| Standard Deviation (Sample) | 3.0% | 6.9% |
| Standard Deviation (Population) | 3.0% | 6.8% |
Similar Demographics by Disability Age 5 to 17
Demographics Similar to Immigrants from Yemen by Disability Age 5 to 17
In terms of disability age 5 to 17, the demographic groups most similar to Immigrants from Yemen are Russian (5.3%, a difference of 0.030%), Immigrants from South Africa (5.3%, a difference of 0.070%), Immigrants from Northern Africa (5.3%, a difference of 0.11%), Immigrants from Italy (5.3%, a difference of 0.13%), and Immigrants from Eritrea (5.3%, a difference of 0.16%).
| Demographics | Rating | Rank | Disability Age 5 to 17 |
| Cambodians | 98.8 /100 | #99 | Exceptional 5.3% |
| Nepalese | 98.7 /100 | #100 | Exceptional 5.3% |
| Menominee | 98.7 /100 | #101 | Exceptional 5.3% |
| Nicaraguans | 98.6 /100 | #102 | Exceptional 5.3% |
| Salvadorans | 98.6 /100 | #103 | Exceptional 5.3% |
| Peruvians | 98.5 /100 | #104 | Exceptional 5.3% |
| Immigrants | Italy | 98.4 /100 | #105 | Exceptional 5.3% |
| Immigrants | Yemen | 98.2 /100 | #106 | Exceptional 5.3% |
| Russians | 98.2 /100 | #107 | Exceptional 5.3% |
| Immigrants | South Africa | 98.1 /100 | #108 | Exceptional 5.3% |
| Immigrants | Northern Africa | 98.1 /100 | #109 | Exceptional 5.3% |
| Immigrants | Eritrea | 98.0 /100 | #110 | Exceptional 5.3% |
| Ethiopians | 97.9 /100 | #111 | Exceptional 5.3% |
| Immigrants | Latvia | 97.9 /100 | #112 | Exceptional 5.3% |
| Aleuts | 97.8 /100 | #113 | Exceptional 5.3% |
Demographics Similar to French Canadians by Disability Age 5 to 17
In terms of disability age 5 to 17, the demographic groups most similar to French Canadians are Immigrants from the Azores (6.7%, a difference of 0.020%), Dutch West Indian (6.7%, a difference of 0.080%), Black/African American (6.8%, a difference of 0.61%), Seminole (6.8%, a difference of 0.66%), and Ottawa (6.8%, a difference of 1.4%).
| Demographics | Rating | Rank | Disability Age 5 to 17 |
| Dominicans | 0.0 /100 | #324 | Tragic 6.5% |
| Americans | 0.0 /100 | #325 | Tragic 6.5% |
| Potawatomi | 0.0 /100 | #326 | Tragic 6.5% |
| French American Indians | 0.0 /100 | #327 | Tragic 6.6% |
| Pennsylvania Germans | 0.0 /100 | #328 | Tragic 6.6% |
| Blackfeet | 0.0 /100 | #329 | Tragic 6.6% |
| Dutch West Indians | 0.0 /100 | #330 | Tragic 6.7% |
| French Canadians | 0.0 /100 | #331 | Tragic 6.7% |
| Immigrants | Azores | 0.0 /100 | #332 | Tragic 6.7% |
| Blacks/African Americans | 0.0 /100 | #333 | Tragic 6.8% |
| Seminole | 0.0 /100 | #334 | Tragic 6.8% |
| Ottawa | 0.0 /100 | #335 | Tragic 6.8% |
| Chickasaw | 0.0 /100 | #336 | Tragic 6.8% |
| Creek | 0.0 /100 | #337 | Tragic 6.9% |
| Iroquois | 0.0 /100 | #338 | Tragic 6.9% |