Osage vs Immigrants from Cabo Verde Ambulatory Disability
COMPARE
Osage
Immigrants from Cabo Verde
Ambulatory Disability
Ambulatory Disability Comparison
Osage
Immigrants from Cabo Verde
7.4%
AMBULATORY DISABILITY
0.0/ 100
METRIC RATING
322nd/ 347
METRIC RANK
7.0%
AMBULATORY DISABILITY
0.0/ 100
METRIC RATING
304th/ 347
METRIC RANK
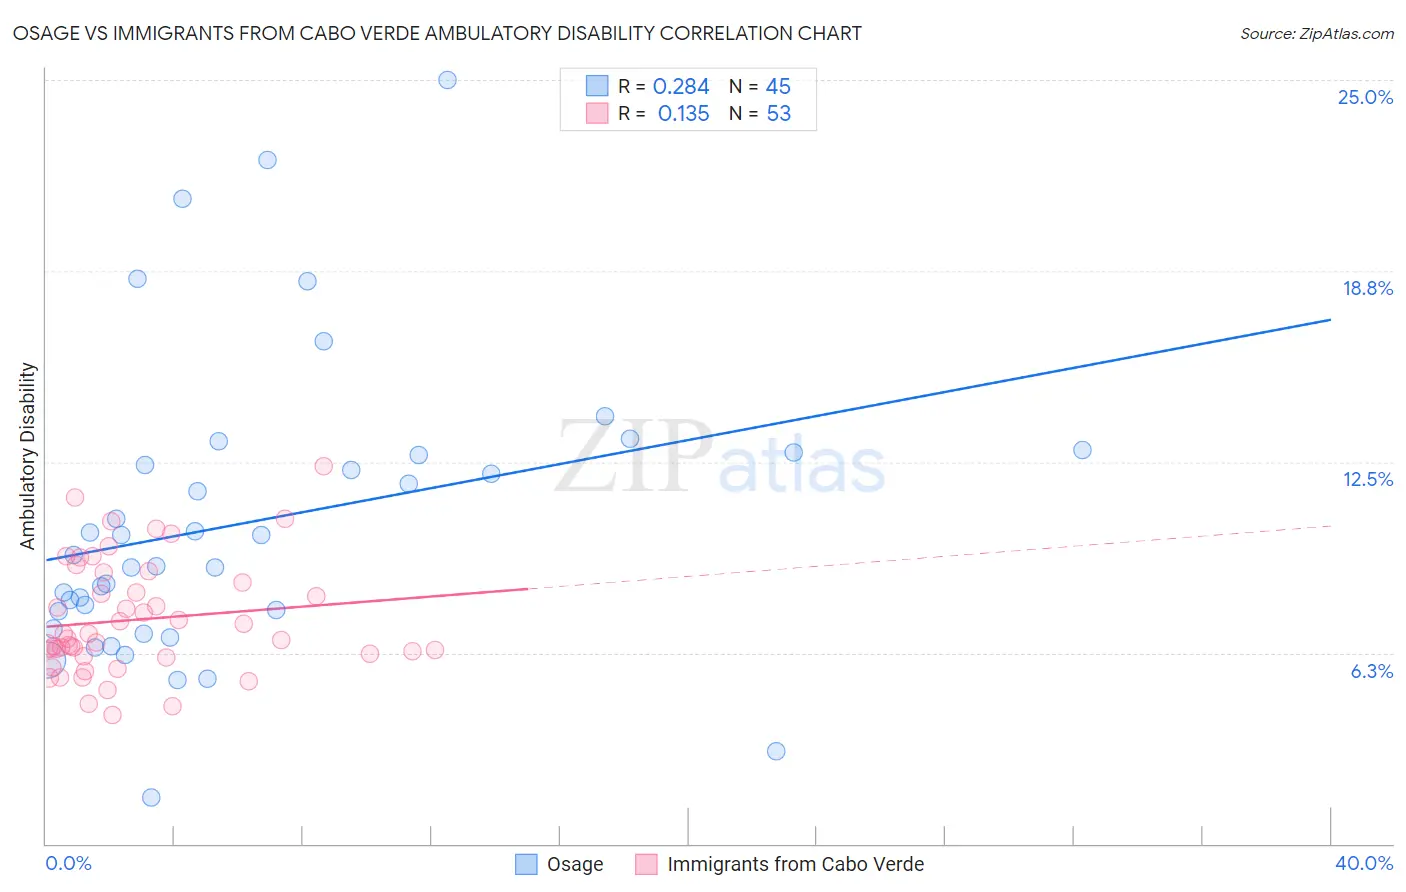
Osage vs Immigrants from Cabo Verde Ambulatory Disability Correlation Chart
The statistical analysis conducted on geographies consisting of 91,795,743 people shows a weak positive correlation between the proportion of Osage and percentage of population with ambulatory disability in the United States with a correlation coefficient (R) of 0.284 and weighted average of 7.4%. Similarly, the statistical analysis conducted on geographies consisting of 38,149,836 people shows a poor positive correlation between the proportion of Immigrants from Cabo Verde and percentage of population with ambulatory disability in the United States with a correlation coefficient (R) of 0.135 and weighted average of 7.0%, a difference of 5.6%.
Ambulatory Disability Correlation Summary
| Measurement | Osage | Immigrants from Cabo Verde |
| Minimum | 1.5% | 4.2% |
| Maximum | 25.0% | 12.3% |
| Range | 23.5% | 8.1% |
| Mean | 10.5% | 7.3% |
| Median | 9.5% | 6.7% |
| Interquartile 25% (IQ1) | 7.3% | 6.2% |
| Interquartile 75% (IQ3) | 12.8% | 8.7% |
| Interquartile Range (IQR) | 5.5% | 2.5% |
| Standard Deviation (Sample) | 4.9% | 1.8% |
| Standard Deviation (Population) | 4.8% | 1.8% |
Demographics Similar to Osage and Immigrants from Cabo Verde by Ambulatory Disability
In terms of ambulatory disability, the demographic groups most similar to Osage are Apache (7.4%, a difference of 0.14%), American (7.4%, a difference of 0.28%), Potawatomi (7.3%, a difference of 0.95%), Dominican (7.2%, a difference of 2.8%), and Ottawa (7.2%, a difference of 3.2%). Similarly, the demographic groups most similar to Immigrants from Cabo Verde are Immigrants from Micronesia (7.0%, a difference of 0.29%), African (7.0%, a difference of 0.36%), Iroquois (7.1%, a difference of 0.82%), Spanish American (7.1%, a difference of 1.1%), and Chippewa (7.1%, a difference of 1.1%).
| Demographics | Rating | Rank | Ambulatory Disability |
| Africans | 0.0 /100 | #303 | Tragic 7.0% |
| Immigrants | Cabo Verde | 0.0 /100 | #304 | Tragic 7.0% |
| Immigrants | Micronesia | 0.0 /100 | #305 | Tragic 7.0% |
| Iroquois | 0.0 /100 | #306 | Tragic 7.1% |
| Spanish Americans | 0.0 /100 | #307 | Tragic 7.1% |
| Chippewa | 0.0 /100 | #308 | Tragic 7.1% |
| Immigrants | Azores | 0.0 /100 | #309 | Tragic 7.1% |
| Arapaho | 0.0 /100 | #310 | Tragic 7.1% |
| Cree | 0.0 /100 | #311 | Tragic 7.1% |
| Delaware | 0.0 /100 | #312 | Tragic 7.1% |
| Immigrants | Yemen | 0.0 /100 | #313 | Tragic 7.1% |
| Blackfeet | 0.0 /100 | #314 | Tragic 7.1% |
| Shoshone | 0.0 /100 | #315 | Tragic 7.1% |
| Immigrants | Dominican Republic | 0.0 /100 | #316 | Tragic 7.1% |
| Central American Indians | 0.0 /100 | #317 | Tragic 7.2% |
| Ottawa | 0.0 /100 | #318 | Tragic 7.2% |
| Dominicans | 0.0 /100 | #319 | Tragic 7.2% |
| Potawatomi | 0.0 /100 | #320 | Tragic 7.3% |
| Apache | 0.0 /100 | #321 | Tragic 7.4% |
| Osage | 0.0 /100 | #322 | Tragic 7.4% |
| Americans | 0.0 /100 | #323 | Tragic 7.4% |