Afghan vs Immigrants from Cabo Verde Ambulatory Disability
COMPARE
Afghan
Immigrants from Cabo Verde
Ambulatory Disability
Ambulatory Disability Comparison
Afghans
Immigrants from Cabo Verde
5.5%
AMBULATORY DISABILITY
100.0/ 100
METRIC RATING
35th/ 347
METRIC RANK
7.0%
AMBULATORY DISABILITY
0.0/ 100
METRIC RATING
304th/ 347
METRIC RANK
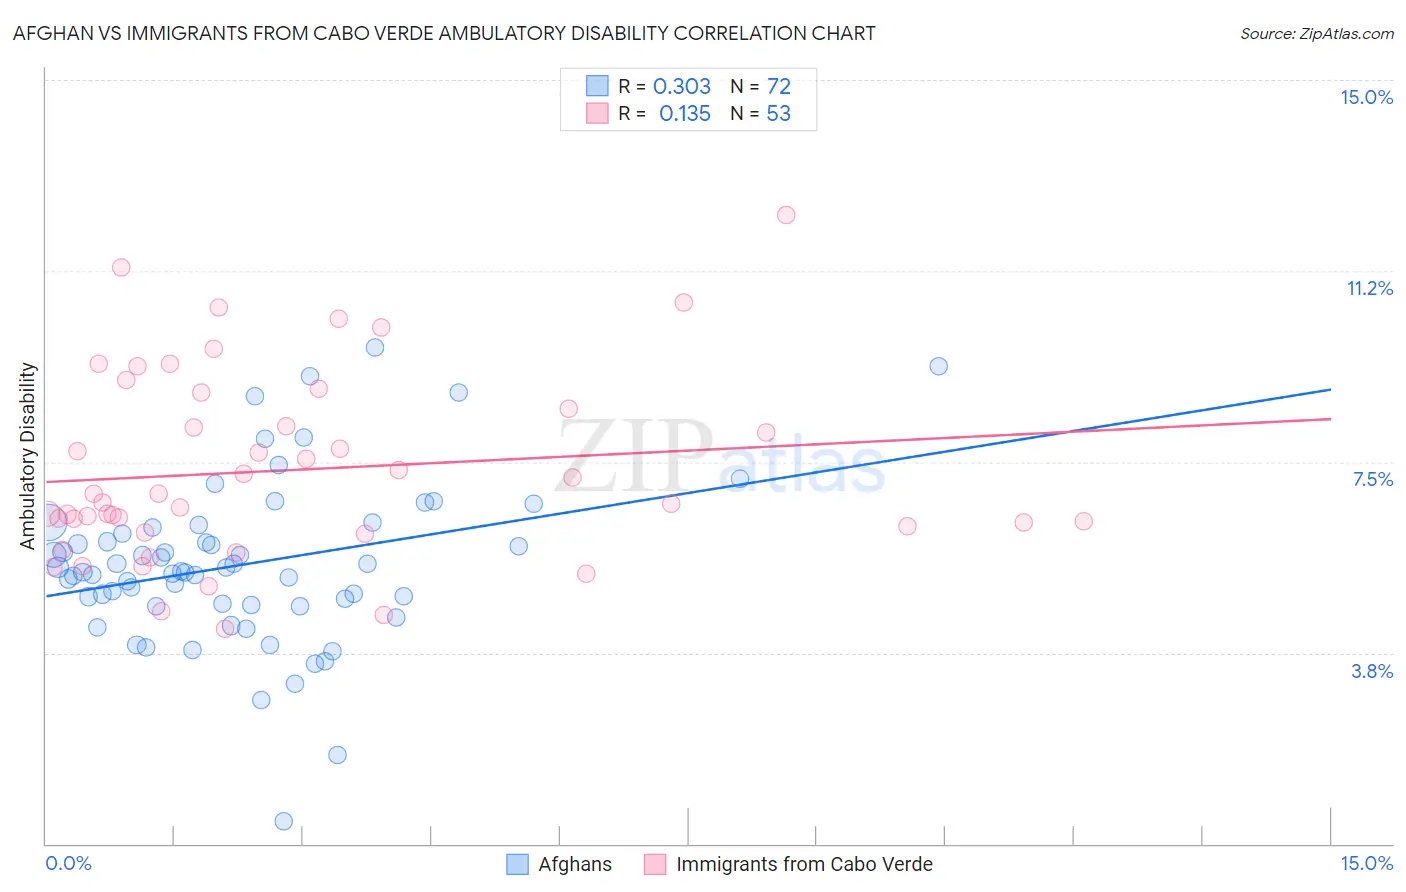
Afghan vs Immigrants from Cabo Verde Ambulatory Disability Correlation Chart
The statistical analysis conducted on geographies consisting of 148,854,459 people shows a mild positive correlation between the proportion of Afghans and percentage of population with ambulatory disability in the United States with a correlation coefficient (R) of 0.303 and weighted average of 5.5%. Similarly, the statistical analysis conducted on geographies consisting of 38,149,836 people shows a poor positive correlation between the proportion of Immigrants from Cabo Verde and percentage of population with ambulatory disability in the United States with a correlation coefficient (R) of 0.135 and weighted average of 7.0%, a difference of 27.8%.
Ambulatory Disability Correlation Summary
| Measurement | Afghan | Immigrants from Cabo Verde |
| Minimum | 0.43% | 4.2% |
| Maximum | 9.8% | 12.3% |
| Range | 9.3% | 8.1% |
| Mean | 5.5% | 7.3% |
| Median | 5.3% | 6.7% |
| Interquartile 25% (IQ1) | 4.7% | 6.2% |
| Interquartile 75% (IQ3) | 6.2% | 8.7% |
| Interquartile Range (IQR) | 1.5% | 2.5% |
| Standard Deviation (Sample) | 1.6% | 1.8% |
| Standard Deviation (Population) | 1.6% | 1.8% |
Similar Demographics by Ambulatory Disability
Demographics Similar to Afghans by Ambulatory Disability
In terms of ambulatory disability, the demographic groups most similar to Afghans are Immigrants from Asia (5.5%, a difference of 0.040%), Immigrants from Malaysia (5.5%, a difference of 0.070%), Turkish (5.5%, a difference of 0.080%), Cypriot (5.5%, a difference of 0.090%), and Immigrants from Eritrea (5.5%, a difference of 0.18%).
| Demographics | Rating | Rank | Ambulatory Disability |
| Cambodians | 100.0 /100 | #28 | Exceptional 5.4% |
| Immigrants | Iran | 100.0 /100 | #29 | Exceptional 5.4% |
| Immigrants | Turkey | 100.0 /100 | #30 | Exceptional 5.4% |
| Immigrants | Venezuela | 100.0 /100 | #31 | Exceptional 5.4% |
| Immigrants | Australia | 100.0 /100 | #32 | Exceptional 5.5% |
| Immigrants | Pakistan | 100.0 /100 | #33 | Exceptional 5.5% |
| Immigrants | Asia | 100.0 /100 | #34 | Exceptional 5.5% |
| Afghans | 100.0 /100 | #35 | Exceptional 5.5% |
| Immigrants | Malaysia | 100.0 /100 | #36 | Exceptional 5.5% |
| Turks | 100.0 /100 | #37 | Exceptional 5.5% |
| Cypriots | 100.0 /100 | #38 | Exceptional 5.5% |
| Immigrants | Eritrea | 100.0 /100 | #39 | Exceptional 5.5% |
| Venezuelans | 99.9 /100 | #40 | Exceptional 5.5% |
| Mongolians | 99.9 /100 | #41 | Exceptional 5.5% |
| Argentineans | 99.9 /100 | #42 | Exceptional 5.5% |
Demographics Similar to Immigrants from Cabo Verde by Ambulatory Disability
In terms of ambulatory disability, the demographic groups most similar to Immigrants from Cabo Verde are Immigrants from Micronesia (7.0%, a difference of 0.29%), African (7.0%, a difference of 0.36%), Immigrants from Armenia (7.0%, a difference of 0.42%), British West Indian (7.0%, a difference of 0.47%), and Marshallese (6.9%, a difference of 0.70%).
| Demographics | Rating | Rank | Ambulatory Disability |
| French American Indians | 0.0 /100 | #297 | Tragic 6.9% |
| Immigrants | Grenada | 0.0 /100 | #298 | Tragic 6.9% |
| Puget Sound Salish | 0.0 /100 | #299 | Tragic 6.9% |
| Marshallese | 0.0 /100 | #300 | Tragic 6.9% |
| British West Indians | 0.0 /100 | #301 | Tragic 7.0% |
| Immigrants | Armenia | 0.0 /100 | #302 | Tragic 7.0% |
| Africans | 0.0 /100 | #303 | Tragic 7.0% |
| Immigrants | Cabo Verde | 0.0 /100 | #304 | Tragic 7.0% |
| Immigrants | Micronesia | 0.0 /100 | #305 | Tragic 7.0% |
| Iroquois | 0.0 /100 | #306 | Tragic 7.1% |
| Spanish Americans | 0.0 /100 | #307 | Tragic 7.1% |
| Chippewa | 0.0 /100 | #308 | Tragic 7.1% |
| Immigrants | Azores | 0.0 /100 | #309 | Tragic 7.1% |
| Arapaho | 0.0 /100 | #310 | Tragic 7.1% |
| Cree | 0.0 /100 | #311 | Tragic 7.1% |