Menominee vs Immigrants from Cabo Verde 3 or more Vehicles in Household
COMPARE
Menominee
Immigrants from Cabo Verde
3 or more Vehicles in Household
3 or more Vehicles in Household Comparison
Menominee
Immigrants from Cabo Verde
17.2%
3 OR MORE VEHICLES IN HOUSEHOLD
0.2/ 100
METRIC RATING
286th/ 347
METRIC RANK
13.6%
3 OR MORE VEHICLES IN HOUSEHOLD
0.0/ 100
METRIC RATING
333rd/ 347
METRIC RANK
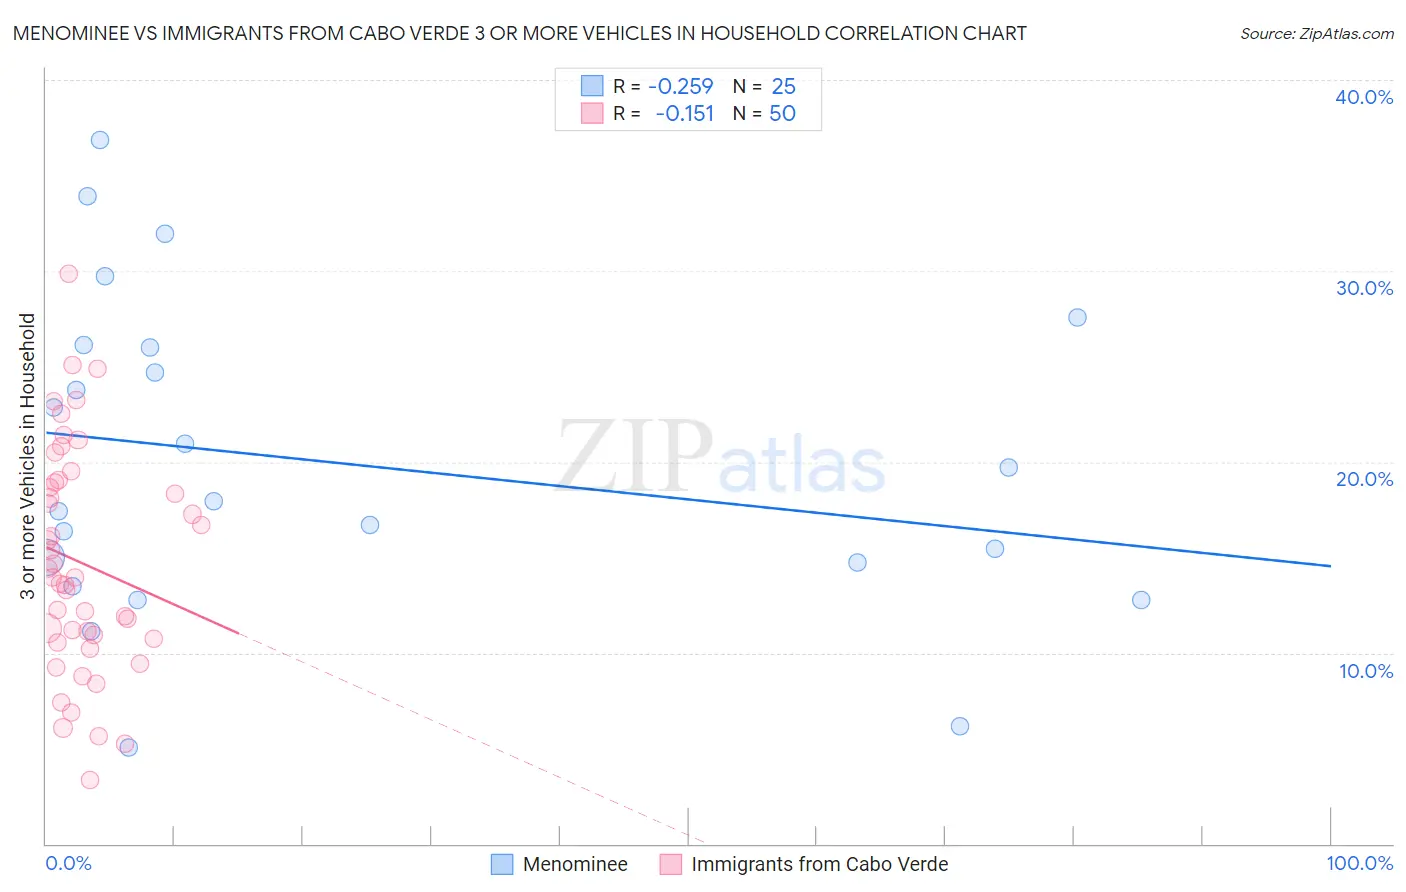
Menominee vs Immigrants from Cabo Verde 3 or more Vehicles in Household Correlation Chart
The statistical analysis conducted on geographies consisting of 45,777,699 people shows a weak negative correlation between the proportion of Menominee and percentage of households with 3 or more vehicles available in the United States with a correlation coefficient (R) of -0.259 and weighted average of 17.2%. Similarly, the statistical analysis conducted on geographies consisting of 38,144,039 people shows a poor negative correlation between the proportion of Immigrants from Cabo Verde and percentage of households with 3 or more vehicles available in the United States with a correlation coefficient (R) of -0.151 and weighted average of 13.6%, a difference of 26.6%.
3 or more Vehicles in Household Correlation Summary
| Measurement | Menominee | Immigrants from Cabo Verde |
| Minimum | 5.1% | 3.3% |
| Maximum | 36.9% | 29.8% |
| Range | 31.8% | 26.5% |
| Mean | 20.0% | 14.7% |
| Median | 18.0% | 13.9% |
| Interquartile 25% (IQ1) | 14.1% | 10.8% |
| Interquartile 75% (IQ3) | 26.1% | 18.9% |
| Interquartile Range (IQR) | 12.0% | 8.2% |
| Standard Deviation (Sample) | 8.3% | 5.9% |
| Standard Deviation (Population) | 8.1% | 5.8% |
Similar Demographics by 3 or more Vehicles in Household
Demographics Similar to Menominee by 3 or more Vehicles in Household
In terms of 3 or more vehicles in household, the demographic groups most similar to Menominee are Immigrants from Croatia (17.2%, a difference of 0.060%), Immigrants from Brazil (17.1%, a difference of 0.30%), Immigrants from Uruguay (17.1%, a difference of 0.39%), Immigrants from Liberia (17.1%, a difference of 0.46%), and Immigrants from Colombia (17.3%, a difference of 0.79%).
| Demographics | Rating | Rank | 3 or more Vehicles in Household |
| Immigrants | Kazakhstan | 0.3 /100 | #279 | Tragic 17.4% |
| Immigrants | Eastern Europe | 0.3 /100 | #280 | Tragic 17.4% |
| Immigrants | Latvia | 0.3 /100 | #281 | Tragic 17.4% |
| Immigrants | Ireland | 0.3 /100 | #282 | Tragic 17.3% |
| Blacks/African Americans | 0.3 /100 | #283 | Tragic 17.3% |
| Immigrants | Colombia | 0.3 /100 | #284 | Tragic 17.3% |
| Immigrants | Croatia | 0.2 /100 | #285 | Tragic 17.2% |
| Menominee | 0.2 /100 | #286 | Tragic 17.2% |
| Immigrants | Brazil | 0.2 /100 | #287 | Tragic 17.1% |
| Immigrants | Uruguay | 0.2 /100 | #288 | Tragic 17.1% |
| Immigrants | Liberia | 0.1 /100 | #289 | Tragic 17.1% |
| Liberians | 0.1 /100 | #290 | Tragic 17.0% |
| Immigrants | Congo | 0.1 /100 | #291 | Tragic 17.0% |
| Immigrants | Spain | 0.1 /100 | #292 | Tragic 17.0% |
| Bahamians | 0.1 /100 | #293 | Tragic 16.9% |
Demographics Similar to Immigrants from Cabo Verde by 3 or more Vehicles in Household
In terms of 3 or more vehicles in household, the demographic groups most similar to Immigrants from Cabo Verde are Trinidadian and Tobagonian (13.6%, a difference of 0.36%), Immigrants from Dominica (13.7%, a difference of 1.1%), Immigrants from Ecuador (13.4%, a difference of 1.3%), West Indian (13.7%, a difference of 1.3%), and Immigrants from Senegal (13.8%, a difference of 1.6%).
| Demographics | Rating | Rank | 3 or more Vehicles in Household |
| Soviet Union | 0.0 /100 | #326 | Tragic 14.2% |
| Ecuadorians | 0.0 /100 | #327 | Tragic 14.1% |
| Immigrants | Albania | 0.0 /100 | #328 | Tragic 14.0% |
| Immigrants | Senegal | 0.0 /100 | #329 | Tragic 13.8% |
| West Indians | 0.0 /100 | #330 | Tragic 13.7% |
| Immigrants | Dominica | 0.0 /100 | #331 | Tragic 13.7% |
| Trinidadians and Tobagonians | 0.0 /100 | #332 | Tragic 13.6% |
| Immigrants | Cabo Verde | 0.0 /100 | #333 | Tragic 13.6% |
| Immigrants | Ecuador | 0.0 /100 | #334 | Tragic 13.4% |
| Immigrants | Trinidad and Tobago | 0.0 /100 | #335 | Tragic 13.3% |
| Barbadians | 0.0 /100 | #336 | Tragic 12.6% |
| Immigrants | Bangladesh | 0.0 /100 | #337 | Tragic 12.5% |
| Vietnamese | 0.0 /100 | #338 | Tragic 12.5% |
| Immigrants | Uzbekistan | 0.0 /100 | #339 | Tragic 12.0% |
| Immigrants | Barbados | 0.0 /100 | #340 | Tragic 11.7% |