Marshallese vs Immigrants from Fiji Ambulatory Disability
COMPARE
Marshallese
Immigrants from Fiji
Ambulatory Disability
Ambulatory Disability Comparison
Marshallese
Immigrants from Fiji
6.9%
AMBULATORY DISABILITY
0.0/ 100
METRIC RATING
300th/ 347
METRIC RANK
6.0%
AMBULATORY DISABILITY
71.2/ 100
METRIC RATING
158th/ 347
METRIC RANK
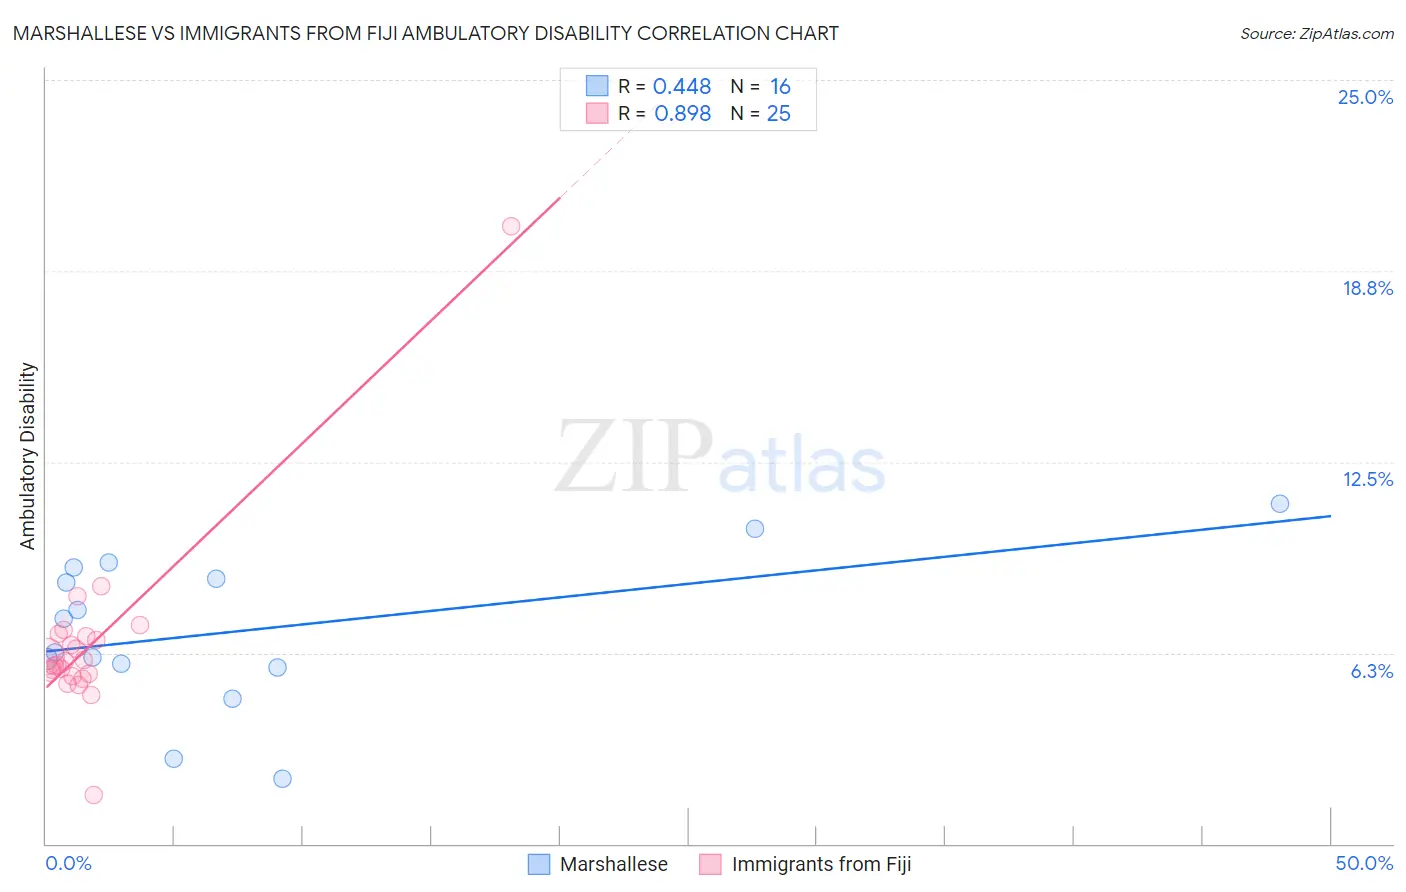
Marshallese vs Immigrants from Fiji Ambulatory Disability Correlation Chart
The statistical analysis conducted on geographies consisting of 14,761,315 people shows a moderate positive correlation between the proportion of Marshallese and percentage of population with ambulatory disability in the United States with a correlation coefficient (R) of 0.448 and weighted average of 6.9%. Similarly, the statistical analysis conducted on geographies consisting of 93,755,380 people shows a very strong positive correlation between the proportion of Immigrants from Fiji and percentage of population with ambulatory disability in the United States with a correlation coefficient (R) of 0.898 and weighted average of 6.0%, a difference of 14.9%.
Ambulatory Disability Correlation Summary
| Measurement | Marshallese | Immigrants from Fiji |
| Minimum | 2.1% | 1.6% |
| Maximum | 11.1% | 20.2% |
| Range | 9.0% | 18.6% |
| Mean | 7.0% | 6.6% |
| Median | 6.8% | 6.0% |
| Interquartile 25% (IQ1) | 5.8% | 5.5% |
| Interquartile 75% (IQ3) | 8.9% | 6.8% |
| Interquartile Range (IQR) | 3.0% | 1.3% |
| Standard Deviation (Sample) | 2.5% | 3.1% |
| Standard Deviation (Population) | 2.4% | 3.0% |
Similar Demographics by Ambulatory Disability
Demographics Similar to Marshallese by Ambulatory Disability
In terms of ambulatory disability, the demographic groups most similar to Marshallese are Puget Sound Salish (6.9%, a difference of 0.010%), Immigrants from Grenada (6.9%, a difference of 0.14%), French American Indian (6.9%, a difference of 0.15%), British West Indian (7.0%, a difference of 0.23%), and Immigrants from Armenia (7.0%, a difference of 0.28%).
| Demographics | Rating | Rank | Ambulatory Disability |
| Immigrants | St. Vincent and the Grenadines | 0.0 /100 | #293 | Tragic 6.9% |
| Cape Verdeans | 0.0 /100 | #294 | Tragic 6.9% |
| Crow | 0.0 /100 | #295 | Tragic 6.9% |
| Alaskan Athabascans | 0.0 /100 | #296 | Tragic 6.9% |
| French American Indians | 0.0 /100 | #297 | Tragic 6.9% |
| Immigrants | Grenada | 0.0 /100 | #298 | Tragic 6.9% |
| Puget Sound Salish | 0.0 /100 | #299 | Tragic 6.9% |
| Marshallese | 0.0 /100 | #300 | Tragic 6.9% |
| British West Indians | 0.0 /100 | #301 | Tragic 7.0% |
| Immigrants | Armenia | 0.0 /100 | #302 | Tragic 7.0% |
| Africans | 0.0 /100 | #303 | Tragic 7.0% |
| Immigrants | Cabo Verde | 0.0 /100 | #304 | Tragic 7.0% |
| Immigrants | Micronesia | 0.0 /100 | #305 | Tragic 7.0% |
| Iroquois | 0.0 /100 | #306 | Tragic 7.1% |
| Spanish Americans | 0.0 /100 | #307 | Tragic 7.1% |
Demographics Similar to Immigrants from Fiji by Ambulatory Disability
In terms of ambulatory disability, the demographic groups most similar to Immigrants from Fiji are Ghanaian (6.0%, a difference of 0.010%), Immigrants from Latvia (6.0%, a difference of 0.010%), Northern European (6.0%, a difference of 0.050%), Immigrants from Scotland (6.0%, a difference of 0.070%), and Central American (6.0%, a difference of 0.080%).
| Demographics | Rating | Rank | Ambulatory Disability |
| Greeks | 79.6 /100 | #151 | Good 6.0% |
| Immigrants | Austria | 78.8 /100 | #152 | Good 6.0% |
| Syrians | 75.5 /100 | #153 | Good 6.0% |
| Immigrants | Croatia | 75.1 /100 | #154 | Good 6.0% |
| Immigrants | Scotland | 72.1 /100 | #155 | Good 6.0% |
| Northern Europeans | 71.8 /100 | #156 | Good 6.0% |
| Ghanaians | 71.3 /100 | #157 | Good 6.0% |
| Immigrants | Fiji | 71.2 /100 | #158 | Good 6.0% |
| Immigrants | Latvia | 71.1 /100 | #159 | Good 6.0% |
| Central Americans | 69.8 /100 | #160 | Good 6.0% |
| Immigrants | Belarus | 69.2 /100 | #161 | Good 6.1% |
| Nigerians | 67.1 /100 | #162 | Good 6.1% |
| Lebanese | 66.2 /100 | #163 | Good 6.1% |
| Basques | 63.7 /100 | #164 | Good 6.1% |
| Nicaraguans | 63.2 /100 | #165 | Good 6.1% |