Immigrants from Scotland vs Immigrants from Fiji Ambulatory Disability
COMPARE
Immigrants from Scotland
Immigrants from Fiji
Ambulatory Disability
Ambulatory Disability Comparison
Immigrants from Scotland
Immigrants from Fiji
6.0%
AMBULATORY DISABILITY
72.1/ 100
METRIC RATING
155th/ 347
METRIC RANK
6.0%
AMBULATORY DISABILITY
71.2/ 100
METRIC RATING
158th/ 347
METRIC RANK
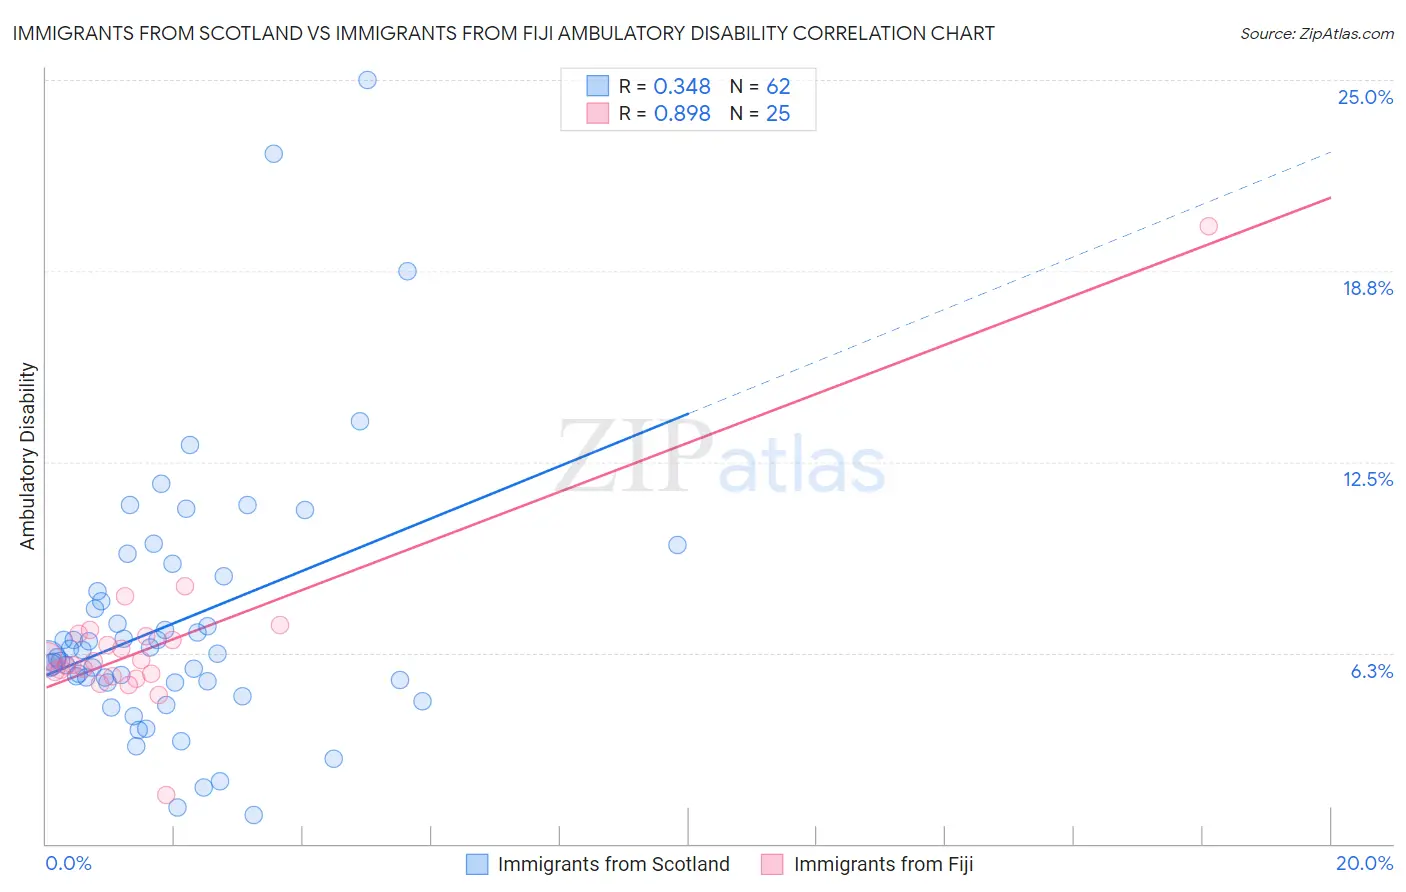
Immigrants from Scotland vs Immigrants from Fiji Ambulatory Disability Correlation Chart
The statistical analysis conducted on geographies consisting of 196,384,965 people shows a mild positive correlation between the proportion of Immigrants from Scotland and percentage of population with ambulatory disability in the United States with a correlation coefficient (R) of 0.348 and weighted average of 6.0%. Similarly, the statistical analysis conducted on geographies consisting of 93,755,380 people shows a very strong positive correlation between the proportion of Immigrants from Fiji and percentage of population with ambulatory disability in the United States with a correlation coefficient (R) of 0.898 and weighted average of 6.0%, a difference of 0.070%.
Ambulatory Disability Correlation Summary
| Measurement | Immigrants from Scotland | Immigrants from Fiji |
| Minimum | 0.96% | 1.6% |
| Maximum | 25.0% | 20.2% |
| Range | 24.0% | 18.6% |
| Mean | 7.2% | 6.6% |
| Median | 6.2% | 6.0% |
| Interquartile 25% (IQ1) | 5.3% | 5.5% |
| Interquartile 75% (IQ3) | 8.2% | 6.8% |
| Interquartile Range (IQR) | 3.0% | 1.3% |
| Standard Deviation (Sample) | 4.4% | 3.1% |
| Standard Deviation (Population) | 4.3% | 3.0% |
Demographics Similar to Immigrants from Scotland and Immigrants from Fiji by Ambulatory Disability
In terms of ambulatory disability, the demographic groups most similar to Immigrants from Scotland are Northern European (6.0%, a difference of 0.020%), Ghanaian (6.0%, a difference of 0.050%), Immigrants from Latvia (6.0%, a difference of 0.070%), Central American (6.0%, a difference of 0.15%), and Immigrants from Belarus (6.1%, a difference of 0.19%). Similarly, the demographic groups most similar to Immigrants from Fiji are Ghanaian (6.0%, a difference of 0.010%), Immigrants from Latvia (6.0%, a difference of 0.010%), Northern European (6.0%, a difference of 0.050%), Central American (6.0%, a difference of 0.080%), and Immigrants from Belarus (6.1%, a difference of 0.13%).
| Demographics | Rating | Rank | Ambulatory Disability |
| Immigrants | Greece | 82.5 /100 | #146 | Excellent 6.0% |
| Immigrants | Moldova | 82.4 /100 | #147 | Excellent 6.0% |
| Immigrants | Eastern Europe | 82.0 /100 | #148 | Excellent 6.0% |
| Lithuanians | 81.9 /100 | #149 | Excellent 6.0% |
| Maltese | 81.6 /100 | #150 | Excellent 6.0% |
| Greeks | 79.6 /100 | #151 | Good 6.0% |
| Immigrants | Austria | 78.8 /100 | #152 | Good 6.0% |
| Syrians | 75.5 /100 | #153 | Good 6.0% |
| Immigrants | Croatia | 75.1 /100 | #154 | Good 6.0% |
| Immigrants | Scotland | 72.1 /100 | #155 | Good 6.0% |
| Northern Europeans | 71.8 /100 | #156 | Good 6.0% |
| Ghanaians | 71.3 /100 | #157 | Good 6.0% |
| Immigrants | Fiji | 71.2 /100 | #158 | Good 6.0% |
| Immigrants | Latvia | 71.1 /100 | #159 | Good 6.0% |
| Central Americans | 69.8 /100 | #160 | Good 6.0% |
| Immigrants | Belarus | 69.2 /100 | #161 | Good 6.1% |
| Nigerians | 67.1 /100 | #162 | Good 6.1% |
| Lebanese | 66.2 /100 | #163 | Good 6.1% |
| Basques | 63.7 /100 | #164 | Good 6.1% |
| Nicaraguans | 63.2 /100 | #165 | Good 6.1% |
| Iraqis | 62.8 /100 | #166 | Good 6.1% |