Marshallese vs Immigrants from Afghanistan Ambulatory Disability
COMPARE
Marshallese
Immigrants from Afghanistan
Ambulatory Disability
Ambulatory Disability Comparison
Marshallese
Immigrants from Afghanistan
6.9%
AMBULATORY DISABILITY
0.0/ 100
METRIC RATING
300th/ 347
METRIC RANK
5.6%
AMBULATORY DISABILITY
99.8/ 100
METRIC RATING
59th/ 347
METRIC RANK
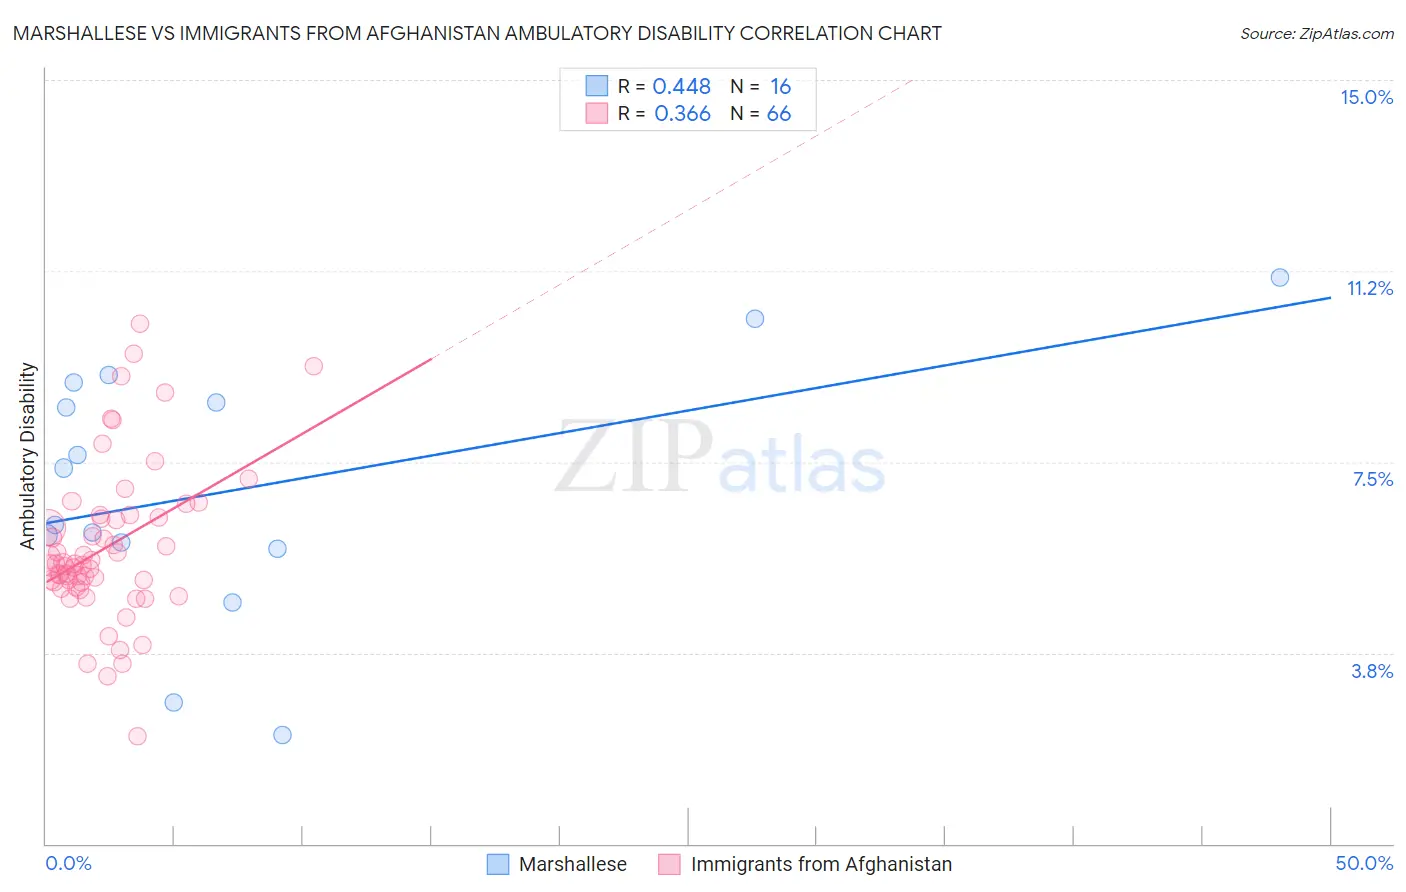
Marshallese vs Immigrants from Afghanistan Ambulatory Disability Correlation Chart
The statistical analysis conducted on geographies consisting of 14,761,315 people shows a moderate positive correlation between the proportion of Marshallese and percentage of population with ambulatory disability in the United States with a correlation coefficient (R) of 0.448 and weighted average of 6.9%. Similarly, the statistical analysis conducted on geographies consisting of 147,636,321 people shows a mild positive correlation between the proportion of Immigrants from Afghanistan and percentage of population with ambulatory disability in the United States with a correlation coefficient (R) of 0.366 and weighted average of 5.6%, a difference of 23.4%.
Ambulatory Disability Correlation Summary
| Measurement | Marshallese | Immigrants from Afghanistan |
| Minimum | 2.1% | 2.1% |
| Maximum | 11.1% | 10.2% |
| Range | 9.0% | 8.1% |
| Mean | 7.0% | 5.8% |
| Median | 6.8% | 5.5% |
| Interquartile 25% (IQ1) | 5.8% | 5.1% |
| Interquartile 75% (IQ3) | 8.9% | 6.4% |
| Interquartile Range (IQR) | 3.0% | 1.3% |
| Standard Deviation (Sample) | 2.5% | 1.5% |
| Standard Deviation (Population) | 2.4% | 1.5% |
Similar Demographics by Ambulatory Disability
Demographics Similar to Marshallese by Ambulatory Disability
In terms of ambulatory disability, the demographic groups most similar to Marshallese are Puget Sound Salish (6.9%, a difference of 0.010%), Immigrants from Grenada (6.9%, a difference of 0.14%), French American Indian (6.9%, a difference of 0.15%), British West Indian (7.0%, a difference of 0.23%), and Immigrants from Armenia (7.0%, a difference of 0.28%).
| Demographics | Rating | Rank | Ambulatory Disability |
| Immigrants | St. Vincent and the Grenadines | 0.0 /100 | #293 | Tragic 6.9% |
| Cape Verdeans | 0.0 /100 | #294 | Tragic 6.9% |
| Crow | 0.0 /100 | #295 | Tragic 6.9% |
| Alaskan Athabascans | 0.0 /100 | #296 | Tragic 6.9% |
| French American Indians | 0.0 /100 | #297 | Tragic 6.9% |
| Immigrants | Grenada | 0.0 /100 | #298 | Tragic 6.9% |
| Puget Sound Salish | 0.0 /100 | #299 | Tragic 6.9% |
| Marshallese | 0.0 /100 | #300 | Tragic 6.9% |
| British West Indians | 0.0 /100 | #301 | Tragic 7.0% |
| Immigrants | Armenia | 0.0 /100 | #302 | Tragic 7.0% |
| Africans | 0.0 /100 | #303 | Tragic 7.0% |
| Immigrants | Cabo Verde | 0.0 /100 | #304 | Tragic 7.0% |
| Immigrants | Micronesia | 0.0 /100 | #305 | Tragic 7.0% |
| Iroquois | 0.0 /100 | #306 | Tragic 7.1% |
| Spanish Americans | 0.0 /100 | #307 | Tragic 7.1% |
Demographics Similar to Immigrants from Afghanistan by Ambulatory Disability
In terms of ambulatory disability, the demographic groups most similar to Immigrants from Afghanistan are Immigrants from Zimbabwe (5.6%, a difference of 0.040%), Immigrants from Lithuania (5.6%, a difference of 0.040%), Immigrants from Brazil (5.6%, a difference of 0.10%), Immigrants from Belgium (5.6%, a difference of 0.16%), and Immigrants from Spain (5.6%, a difference of 0.17%).
| Demographics | Rating | Rank | Ambulatory Disability |
| Jordanians | 99.8 /100 | #52 | Exceptional 5.6% |
| Immigrants | Egypt | 99.8 /100 | #53 | Exceptional 5.6% |
| Immigrants | Eastern Africa | 99.8 /100 | #54 | Exceptional 5.6% |
| Immigrants | Bulgaria | 99.8 /100 | #55 | Exceptional 5.6% |
| Inupiat | 99.8 /100 | #56 | Exceptional 5.6% |
| Immigrants | Brazil | 99.8 /100 | #57 | Exceptional 5.6% |
| Immigrants | Zimbabwe | 99.8 /100 | #58 | Exceptional 5.6% |
| Immigrants | Afghanistan | 99.8 /100 | #59 | Exceptional 5.6% |
| Immigrants | Lithuania | 99.8 /100 | #60 | Exceptional 5.6% |
| Immigrants | Belgium | 99.7 /100 | #61 | Exceptional 5.6% |
| Immigrants | Spain | 99.7 /100 | #62 | Exceptional 5.6% |
| Immigrants | France | 99.7 /100 | #63 | Exceptional 5.6% |
| Laotians | 99.7 /100 | #64 | Exceptional 5.7% |
| Immigrants | Switzerland | 99.7 /100 | #65 | Exceptional 5.7% |
| Israelis | 99.6 /100 | #66 | Exceptional 5.7% |