Icelander vs Immigrants from Fiji Ambulatory Disability
COMPARE
Icelander
Immigrants from Fiji
Ambulatory Disability
Ambulatory Disability Comparison
Icelanders
Immigrants from Fiji
5.9%
AMBULATORY DISABILITY
92.6/ 100
METRIC RATING
122nd/ 347
METRIC RANK
6.0%
AMBULATORY DISABILITY
71.2/ 100
METRIC RATING
158th/ 347
METRIC RANK
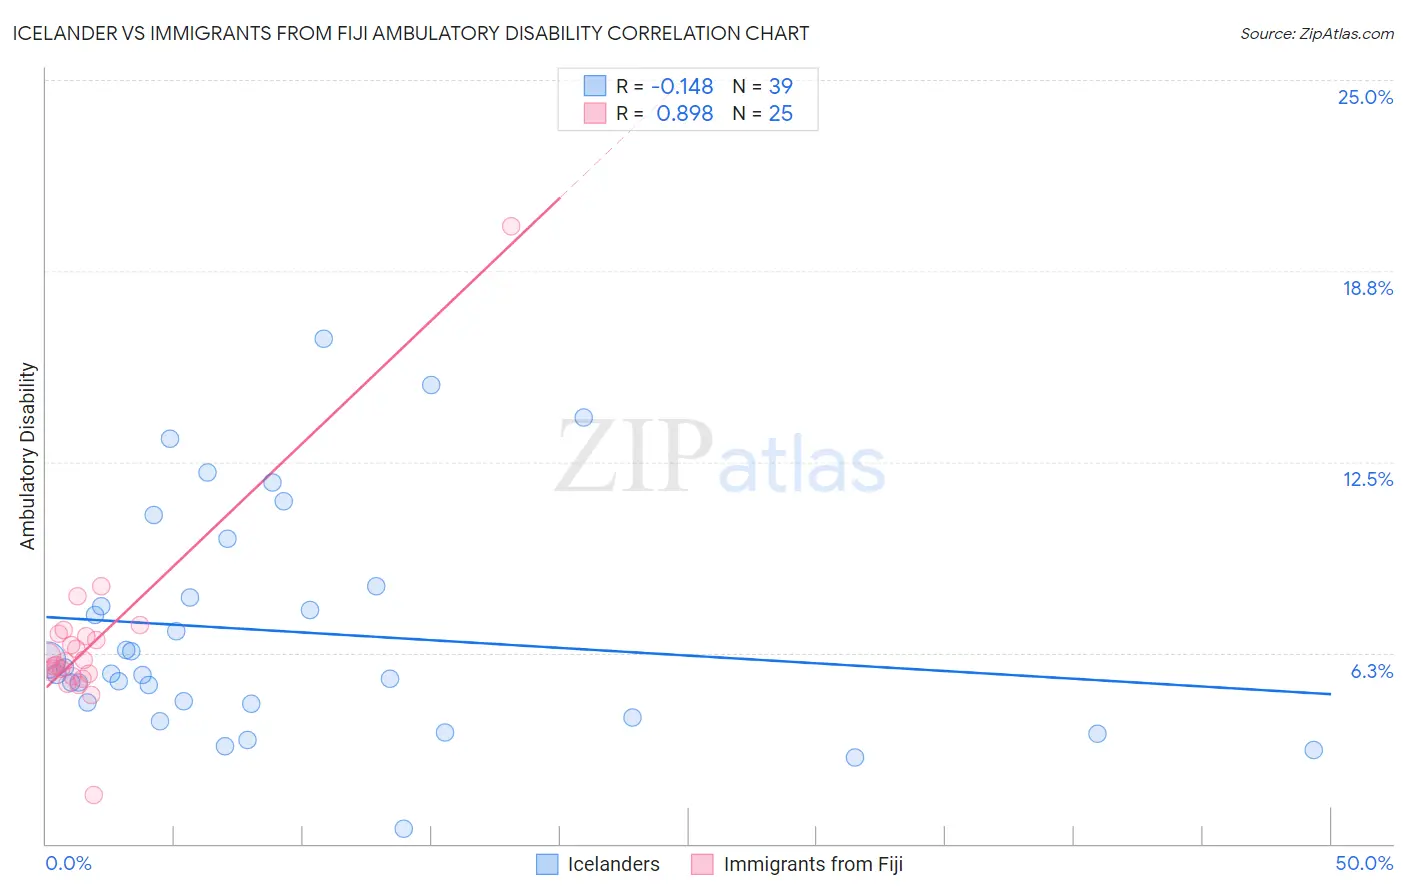
Icelander vs Immigrants from Fiji Ambulatory Disability Correlation Chart
The statistical analysis conducted on geographies consisting of 159,642,692 people shows a poor negative correlation between the proportion of Icelanders and percentage of population with ambulatory disability in the United States with a correlation coefficient (R) of -0.148 and weighted average of 5.9%. Similarly, the statistical analysis conducted on geographies consisting of 93,755,380 people shows a very strong positive correlation between the proportion of Immigrants from Fiji and percentage of population with ambulatory disability in the United States with a correlation coefficient (R) of 0.898 and weighted average of 6.0%, a difference of 2.2%.
Ambulatory Disability Correlation Summary
| Measurement | Icelander | Immigrants from Fiji |
| Minimum | 0.47% | 1.6% |
| Maximum | 16.5% | 20.2% |
| Range | 16.1% | 18.6% |
| Mean | 6.9% | 6.6% |
| Median | 5.6% | 6.0% |
| Interquartile 25% (IQ1) | 4.6% | 5.5% |
| Interquartile 75% (IQ3) | 8.4% | 6.8% |
| Interquartile Range (IQR) | 3.8% | 1.3% |
| Standard Deviation (Sample) | 3.7% | 3.1% |
| Standard Deviation (Population) | 3.7% | 3.0% |
Similar Demographics by Ambulatory Disability
Demographics Similar to Icelanders by Ambulatory Disability
In terms of ambulatory disability, the demographic groups most similar to Icelanders are Costa Rican (5.9%, a difference of 0.0%), Immigrants from Russia (5.9%, a difference of 0.020%), Immigrants from Middle Africa (5.9%, a difference of 0.060%), Estonian (5.9%, a difference of 0.070%), and Norwegian (5.9%, a difference of 0.11%).
| Demographics | Rating | Rank | Ambulatory Disability |
| South American Indians | 94.8 /100 | #115 | Exceptional 5.9% |
| Immigrants | Africa | 94.7 /100 | #116 | Exceptional 5.9% |
| Immigrants | South Eastern Asia | 93.6 /100 | #117 | Exceptional 5.9% |
| Russians | 93.4 /100 | #118 | Exceptional 5.9% |
| Norwegians | 93.1 /100 | #119 | Exceptional 5.9% |
| Estonians | 92.9 /100 | #120 | Exceptional 5.9% |
| Costa Ricans | 92.6 /100 | #121 | Exceptional 5.9% |
| Icelanders | 92.6 /100 | #122 | Exceptional 5.9% |
| Immigrants | Russia | 92.4 /100 | #123 | Exceptional 5.9% |
| Immigrants | Middle Africa | 92.2 /100 | #124 | Exceptional 5.9% |
| Koreans | 91.6 /100 | #125 | Exceptional 5.9% |
| Arabs | 91.5 /100 | #126 | Exceptional 5.9% |
| Immigrants | Nigeria | 90.9 /100 | #127 | Exceptional 5.9% |
| Immigrants | Western Asia | 90.7 /100 | #128 | Exceptional 5.9% |
| Immigrants | Norway | 90.5 /100 | #129 | Exceptional 5.9% |
Demographics Similar to Immigrants from Fiji by Ambulatory Disability
In terms of ambulatory disability, the demographic groups most similar to Immigrants from Fiji are Ghanaian (6.0%, a difference of 0.010%), Immigrants from Latvia (6.0%, a difference of 0.010%), Northern European (6.0%, a difference of 0.050%), Immigrants from Scotland (6.0%, a difference of 0.070%), and Central American (6.0%, a difference of 0.080%).
| Demographics | Rating | Rank | Ambulatory Disability |
| Greeks | 79.6 /100 | #151 | Good 6.0% |
| Immigrants | Austria | 78.8 /100 | #152 | Good 6.0% |
| Syrians | 75.5 /100 | #153 | Good 6.0% |
| Immigrants | Croatia | 75.1 /100 | #154 | Good 6.0% |
| Immigrants | Scotland | 72.1 /100 | #155 | Good 6.0% |
| Northern Europeans | 71.8 /100 | #156 | Good 6.0% |
| Ghanaians | 71.3 /100 | #157 | Good 6.0% |
| Immigrants | Fiji | 71.2 /100 | #158 | Good 6.0% |
| Immigrants | Latvia | 71.1 /100 | #159 | Good 6.0% |
| Central Americans | 69.8 /100 | #160 | Good 6.0% |
| Immigrants | Belarus | 69.2 /100 | #161 | Good 6.1% |
| Nigerians | 67.1 /100 | #162 | Good 6.1% |
| Lebanese | 66.2 /100 | #163 | Good 6.1% |
| Basques | 63.7 /100 | #164 | Good 6.1% |
| Nicaraguans | 63.2 /100 | #165 | Good 6.1% |