Marshallese vs Immigrants from Cambodia Ambulatory Disability
COMPARE
Marshallese
Immigrants from Cambodia
Ambulatory Disability
Ambulatory Disability Comparison
Marshallese
Immigrants from Cambodia
6.9%
AMBULATORY DISABILITY
0.0/ 100
METRIC RATING
300th/ 347
METRIC RANK
6.2%
AMBULATORY DISABILITY
21.5/ 100
METRIC RATING
200th/ 347
METRIC RANK
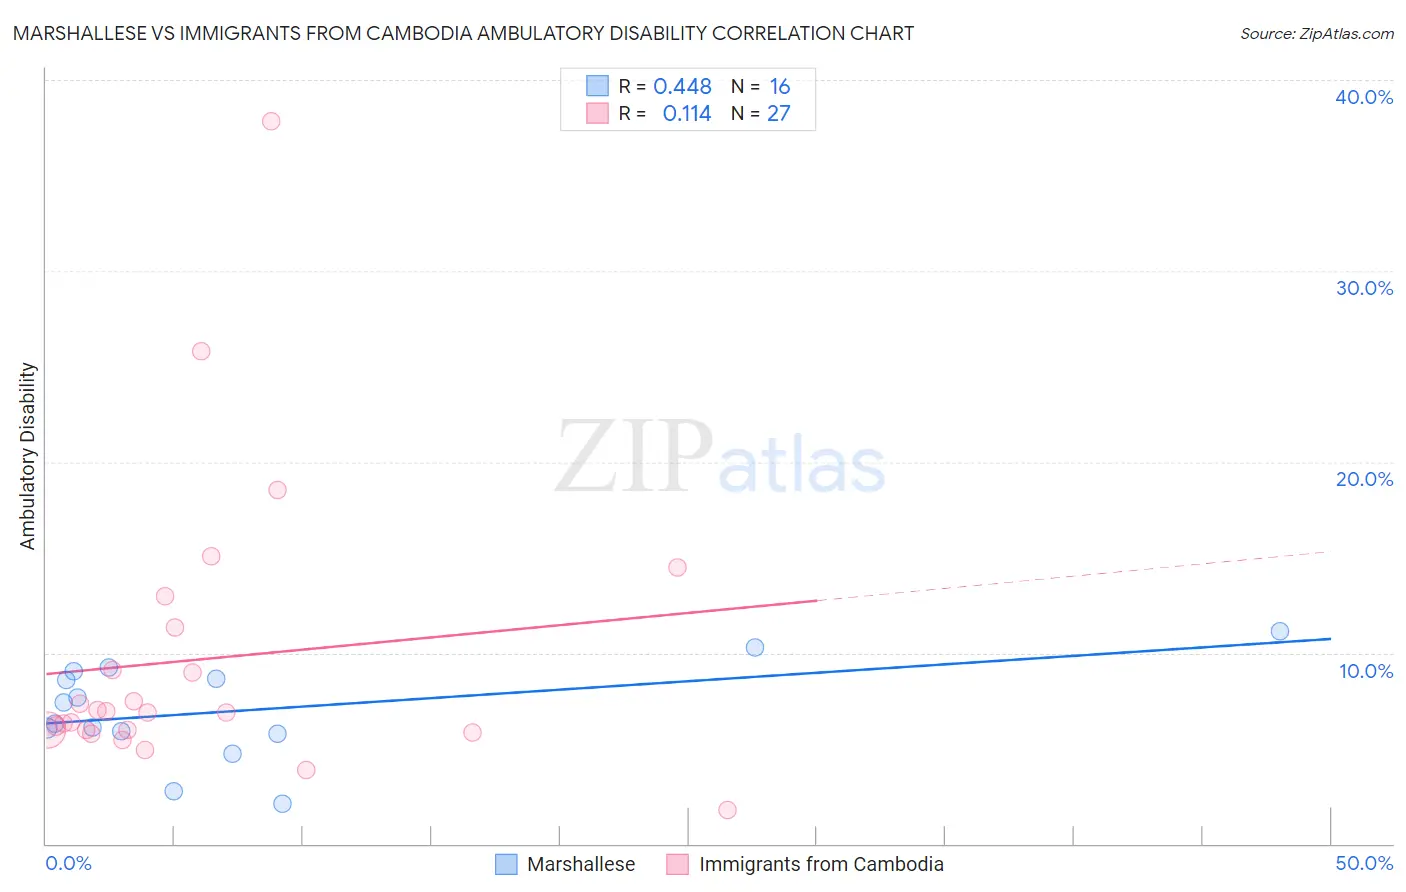
Marshallese vs Immigrants from Cambodia Ambulatory Disability Correlation Chart
The statistical analysis conducted on geographies consisting of 14,761,315 people shows a moderate positive correlation between the proportion of Marshallese and percentage of population with ambulatory disability in the United States with a correlation coefficient (R) of 0.448 and weighted average of 6.9%. Similarly, the statistical analysis conducted on geographies consisting of 205,130,824 people shows a poor positive correlation between the proportion of Immigrants from Cambodia and percentage of population with ambulatory disability in the United States with a correlation coefficient (R) of 0.114 and weighted average of 6.2%, a difference of 11.6%.
Ambulatory Disability Correlation Summary
| Measurement | Marshallese | Immigrants from Cambodia |
| Minimum | 2.1% | 1.8% |
| Maximum | 11.1% | 37.9% |
| Range | 9.0% | 36.1% |
| Mean | 7.0% | 9.7% |
| Median | 6.8% | 6.9% |
| Interquartile 25% (IQ1) | 5.8% | 5.9% |
| Interquartile 75% (IQ3) | 8.9% | 11.3% |
| Interquartile Range (IQR) | 3.0% | 5.4% |
| Standard Deviation (Sample) | 2.5% | 7.6% |
| Standard Deviation (Population) | 2.4% | 7.4% |
Similar Demographics by Ambulatory Disability
Demographics Similar to Marshallese by Ambulatory Disability
In terms of ambulatory disability, the demographic groups most similar to Marshallese are Puget Sound Salish (6.9%, a difference of 0.010%), Immigrants from Grenada (6.9%, a difference of 0.14%), French American Indian (6.9%, a difference of 0.15%), British West Indian (7.0%, a difference of 0.23%), and Immigrants from Armenia (7.0%, a difference of 0.28%).
| Demographics | Rating | Rank | Ambulatory Disability |
| Immigrants | St. Vincent and the Grenadines | 0.0 /100 | #293 | Tragic 6.9% |
| Cape Verdeans | 0.0 /100 | #294 | Tragic 6.9% |
| Crow | 0.0 /100 | #295 | Tragic 6.9% |
| Alaskan Athabascans | 0.0 /100 | #296 | Tragic 6.9% |
| French American Indians | 0.0 /100 | #297 | Tragic 6.9% |
| Immigrants | Grenada | 0.0 /100 | #298 | Tragic 6.9% |
| Puget Sound Salish | 0.0 /100 | #299 | Tragic 6.9% |
| Marshallese | 0.0 /100 | #300 | Tragic 6.9% |
| British West Indians | 0.0 /100 | #301 | Tragic 7.0% |
| Immigrants | Armenia | 0.0 /100 | #302 | Tragic 7.0% |
| Africans | 0.0 /100 | #303 | Tragic 7.0% |
| Immigrants | Cabo Verde | 0.0 /100 | #304 | Tragic 7.0% |
| Immigrants | Micronesia | 0.0 /100 | #305 | Tragic 7.0% |
| Iroquois | 0.0 /100 | #306 | Tragic 7.1% |
| Spanish Americans | 0.0 /100 | #307 | Tragic 7.1% |
Demographics Similar to Immigrants from Cambodia by Ambulatory Disability
In terms of ambulatory disability, the demographic groups most similar to Immigrants from Cambodia are Italian (6.2%, a difference of 0.080%), Immigrants from Central America (6.2%, a difference of 0.11%), Albanian (6.2%, a difference of 0.14%), Immigrants from Bangladesh (6.2%, a difference of 0.22%), and Immigrants from Ukraine (6.2%, a difference of 0.25%).
| Demographics | Rating | Rank | Ambulatory Disability |
| Guatemalans | 30.0 /100 | #193 | Fair 6.2% |
| Alaska Natives | 29.8 /100 | #194 | Fair 6.2% |
| Belgians | 28.6 /100 | #195 | Fair 6.2% |
| Malaysians | 28.2 /100 | #196 | Fair 6.2% |
| Poles | 26.3 /100 | #197 | Fair 6.2% |
| Immigrants | Bangladesh | 24.6 /100 | #198 | Fair 6.2% |
| Italians | 22.6 /100 | #199 | Fair 6.2% |
| Immigrants | Cambodia | 21.5 /100 | #200 | Fair 6.2% |
| Immigrants | Central America | 20.1 /100 | #201 | Fair 6.2% |
| Albanians | 19.7 /100 | #202 | Poor 6.2% |
| Immigrants | Ukraine | 18.4 /100 | #203 | Poor 6.2% |
| Immigrants | Congo | 18.2 /100 | #204 | Poor 6.2% |
| Slovenes | 18.0 /100 | #205 | Poor 6.2% |
| Finns | 17.2 /100 | #206 | Poor 6.2% |
| Alsatians | 15.1 /100 | #207 | Poor 6.3% |