Indian (Asian) vs Immigrants from Fiji Ambulatory Disability
COMPARE
Indian (Asian)
Immigrants from Fiji
Ambulatory Disability
Ambulatory Disability Comparison
Indians (Asian)
Immigrants from Fiji
5.4%
AMBULATORY DISABILITY
100.0/ 100
METRIC RATING
19th/ 347
METRIC RANK
6.0%
AMBULATORY DISABILITY
71.2/ 100
METRIC RATING
158th/ 347
METRIC RANK
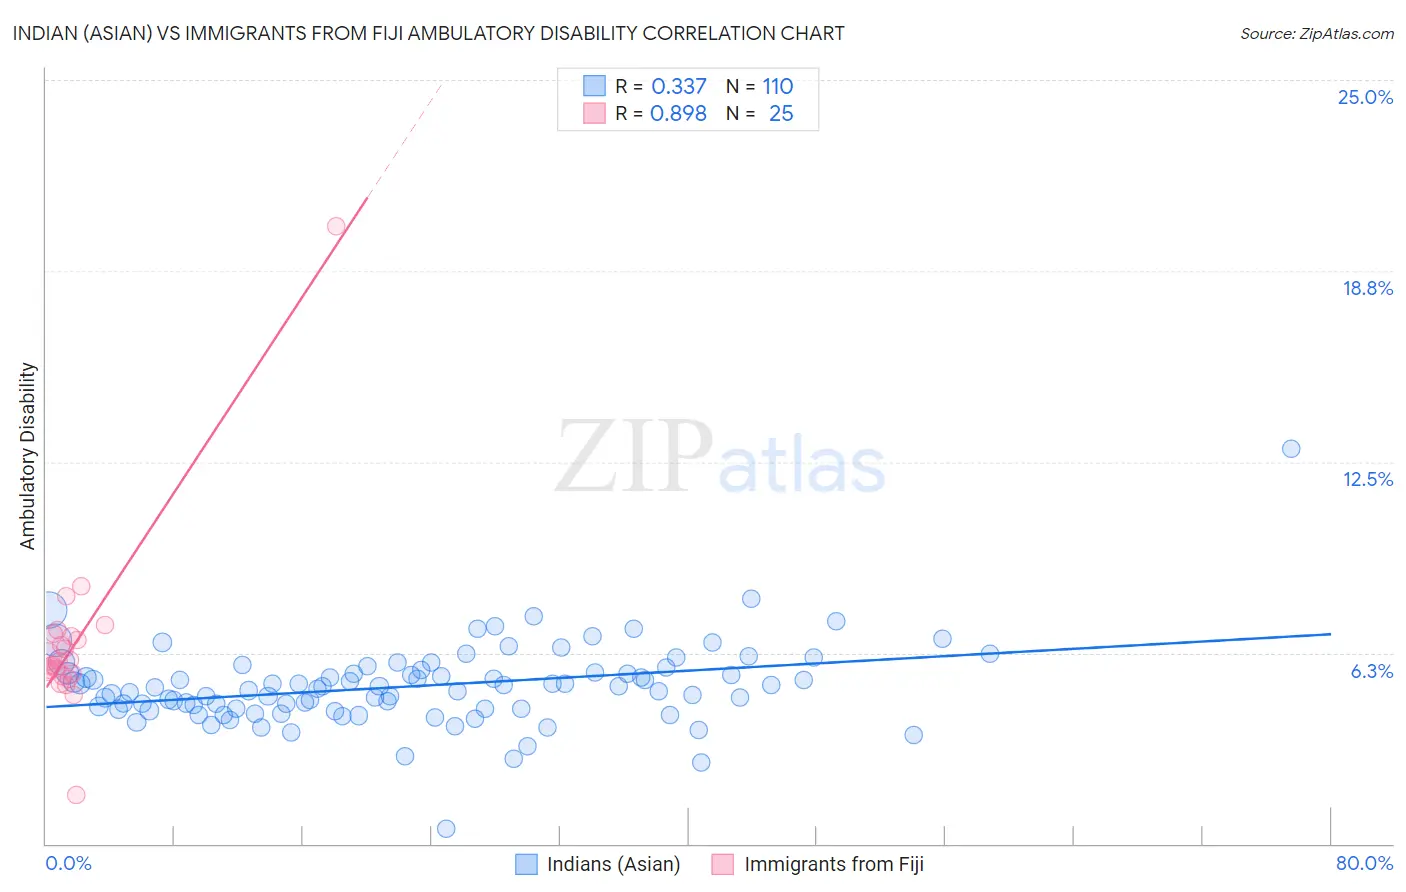
Indian (Asian) vs Immigrants from Fiji Ambulatory Disability Correlation Chart
The statistical analysis conducted on geographies consisting of 495,002,853 people shows a mild positive correlation between the proportion of Indians (Asian) and percentage of population with ambulatory disability in the United States with a correlation coefficient (R) of 0.337 and weighted average of 5.4%. Similarly, the statistical analysis conducted on geographies consisting of 93,755,380 people shows a very strong positive correlation between the proportion of Immigrants from Fiji and percentage of population with ambulatory disability in the United States with a correlation coefficient (R) of 0.898 and weighted average of 6.0%, a difference of 12.7%.
Ambulatory Disability Correlation Summary
| Measurement | Indian (Asian) | Immigrants from Fiji |
| Minimum | 0.51% | 1.6% |
| Maximum | 12.9% | 20.2% |
| Range | 12.4% | 18.6% |
| Mean | 5.2% | 6.6% |
| Median | 5.1% | 6.0% |
| Interquartile 25% (IQ1) | 4.4% | 5.5% |
| Interquartile 75% (IQ3) | 5.6% | 6.8% |
| Interquartile Range (IQR) | 1.2% | 1.3% |
| Standard Deviation (Sample) | 1.3% | 3.1% |
| Standard Deviation (Population) | 1.3% | 3.0% |
Similar Demographics by Ambulatory Disability
Demographics Similar to Indians (Asian) by Ambulatory Disability
In terms of ambulatory disability, the demographic groups most similar to Indians (Asian) are Ethiopian (5.4%, a difference of 0.020%), Immigrants from Kuwait (5.4%, a difference of 0.020%), Immigrants from Sri Lanka (5.4%, a difference of 0.10%), Immigrants from Ethiopia (5.4%, a difference of 0.11%), and Immigrants from Israel (5.4%, a difference of 0.39%).
| Demographics | Rating | Rank | Ambulatory Disability |
| Okinawans | 100.0 /100 | #12 | Exceptional 5.3% |
| Burmese | 100.0 /100 | #13 | Exceptional 5.3% |
| Immigrants | Eastern Asia | 100.0 /100 | #14 | Exceptional 5.3% |
| Immigrants | China | 100.0 /100 | #15 | Exceptional 5.3% |
| Immigrants | Hong Kong | 100.0 /100 | #16 | Exceptional 5.3% |
| Immigrants | Ethiopia | 100.0 /100 | #17 | Exceptional 5.4% |
| Immigrants | Sri Lanka | 100.0 /100 | #18 | Exceptional 5.4% |
| Indians (Asian) | 100.0 /100 | #19 | Exceptional 5.4% |
| Ethiopians | 100.0 /100 | #20 | Exceptional 5.4% |
| Immigrants | Kuwait | 100.0 /100 | #21 | Exceptional 5.4% |
| Immigrants | Israel | 100.0 /100 | #22 | Exceptional 5.4% |
| Tongans | 100.0 /100 | #23 | Exceptional 5.4% |
| Immigrants | Saudi Arabia | 100.0 /100 | #24 | Exceptional 5.4% |
| Zimbabweans | 100.0 /100 | #25 | Exceptional 5.4% |
| Immigrants | Nepal | 100.0 /100 | #26 | Exceptional 5.4% |
Demographics Similar to Immigrants from Fiji by Ambulatory Disability
In terms of ambulatory disability, the demographic groups most similar to Immigrants from Fiji are Ghanaian (6.0%, a difference of 0.010%), Immigrants from Latvia (6.0%, a difference of 0.010%), Northern European (6.0%, a difference of 0.050%), Immigrants from Scotland (6.0%, a difference of 0.070%), and Central American (6.0%, a difference of 0.080%).
| Demographics | Rating | Rank | Ambulatory Disability |
| Greeks | 79.6 /100 | #151 | Good 6.0% |
| Immigrants | Austria | 78.8 /100 | #152 | Good 6.0% |
| Syrians | 75.5 /100 | #153 | Good 6.0% |
| Immigrants | Croatia | 75.1 /100 | #154 | Good 6.0% |
| Immigrants | Scotland | 72.1 /100 | #155 | Good 6.0% |
| Northern Europeans | 71.8 /100 | #156 | Good 6.0% |
| Ghanaians | 71.3 /100 | #157 | Good 6.0% |
| Immigrants | Fiji | 71.2 /100 | #158 | Good 6.0% |
| Immigrants | Latvia | 71.1 /100 | #159 | Good 6.0% |
| Central Americans | 69.8 /100 | #160 | Good 6.0% |
| Immigrants | Belarus | 69.2 /100 | #161 | Good 6.1% |
| Nigerians | 67.1 /100 | #162 | Good 6.1% |
| Lebanese | 66.2 /100 | #163 | Good 6.1% |
| Basques | 63.7 /100 | #164 | Good 6.1% |
| Nicaraguans | 63.2 /100 | #165 | Good 6.1% |