Marshallese vs Shoshone Ambulatory Disability
COMPARE
Marshallese
Shoshone
Ambulatory Disability
Ambulatory Disability Comparison
Marshallese
Shoshone
6.9%
AMBULATORY DISABILITY
0.0/ 100
METRIC RATING
300th/ 347
METRIC RANK
7.1%
AMBULATORY DISABILITY
0.0/ 100
METRIC RATING
315th/ 347
METRIC RANK
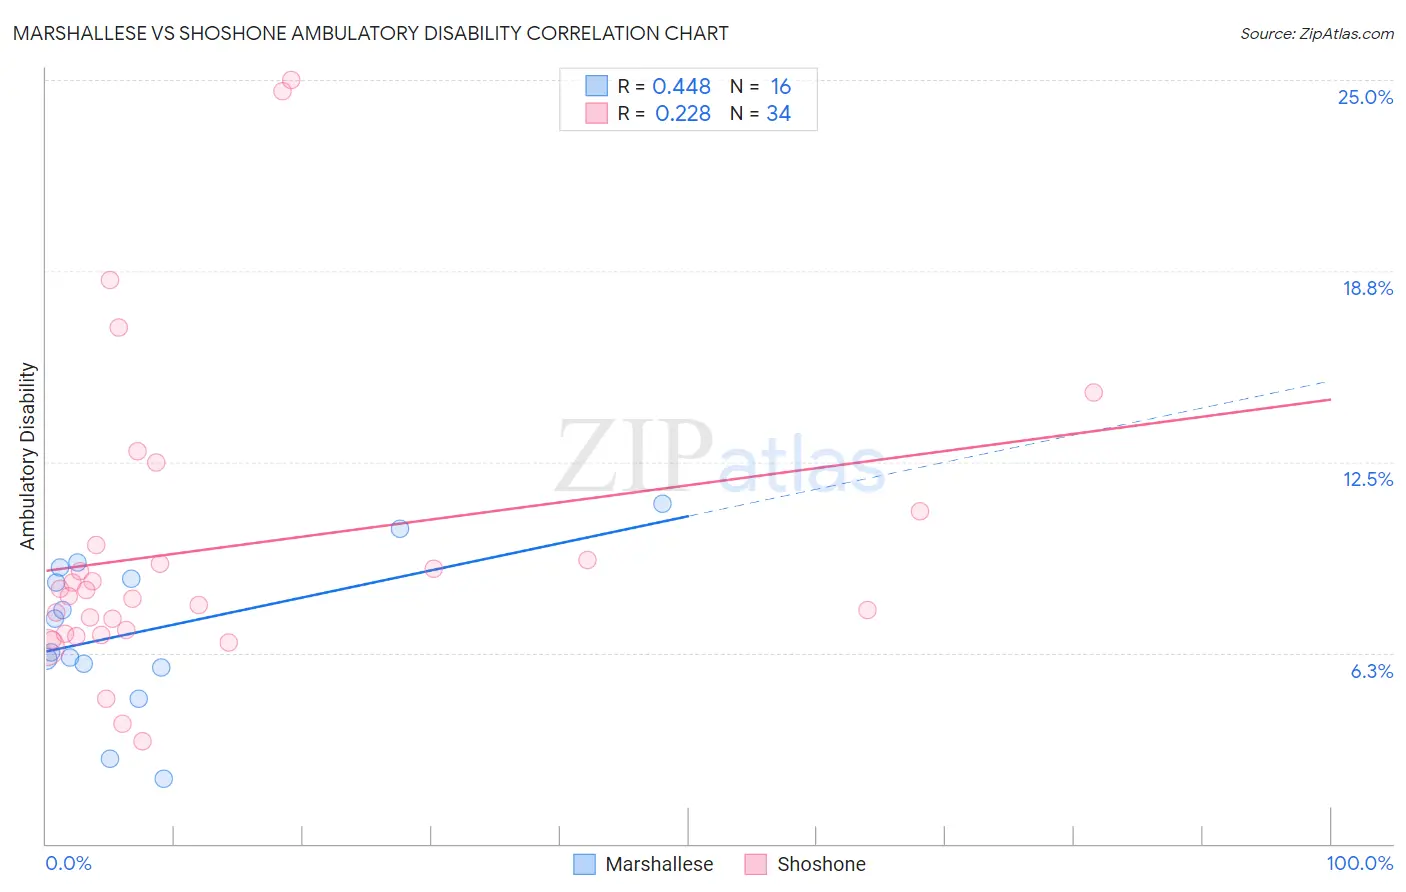
Marshallese vs Shoshone Ambulatory Disability Correlation Chart
The statistical analysis conducted on geographies consisting of 14,761,315 people shows a moderate positive correlation between the proportion of Marshallese and percentage of population with ambulatory disability in the United States with a correlation coefficient (R) of 0.448 and weighted average of 6.9%. Similarly, the statistical analysis conducted on geographies consisting of 66,618,747 people shows a weak positive correlation between the proportion of Shoshone and percentage of population with ambulatory disability in the United States with a correlation coefficient (R) of 0.228 and weighted average of 7.1%, a difference of 2.7%.
Ambulatory Disability Correlation Summary
| Measurement | Marshallese | Shoshone |
| Minimum | 2.1% | 3.4% |
| Maximum | 11.1% | 25.0% |
| Range | 9.0% | 21.6% |
| Mean | 7.0% | 9.7% |
| Median | 6.8% | 8.2% |
| Interquartile 25% (IQ1) | 5.8% | 6.9% |
| Interquartile 75% (IQ3) | 8.9% | 9.8% |
| Interquartile Range (IQR) | 3.0% | 2.9% |
| Standard Deviation (Sample) | 2.5% | 5.0% |
| Standard Deviation (Population) | 2.4% | 4.9% |
Demographics Similar to Marshallese and Shoshone by Ambulatory Disability
In terms of ambulatory disability, the demographic groups most similar to Marshallese are Puget Sound Salish (6.9%, a difference of 0.010%), Immigrants from Grenada (6.9%, a difference of 0.14%), French American Indian (6.9%, a difference of 0.15%), British West Indian (7.0%, a difference of 0.23%), and Immigrants from Armenia (7.0%, a difference of 0.28%). Similarly, the demographic groups most similar to Shoshone are Blackfeet (7.1%, a difference of 0.020%), Immigrants from Yemen (7.1%, a difference of 0.040%), Delaware (7.1%, a difference of 0.17%), Immigrants from Dominican Republic (7.1%, a difference of 0.24%), and Central American Indian (7.2%, a difference of 0.32%).
| Demographics | Rating | Rank | Ambulatory Disability |
| French American Indians | 0.0 /100 | #297 | Tragic 6.9% |
| Immigrants | Grenada | 0.0 /100 | #298 | Tragic 6.9% |
| Puget Sound Salish | 0.0 /100 | #299 | Tragic 6.9% |
| Marshallese | 0.0 /100 | #300 | Tragic 6.9% |
| British West Indians | 0.0 /100 | #301 | Tragic 7.0% |
| Immigrants | Armenia | 0.0 /100 | #302 | Tragic 7.0% |
| Africans | 0.0 /100 | #303 | Tragic 7.0% |
| Immigrants | Cabo Verde | 0.0 /100 | #304 | Tragic 7.0% |
| Immigrants | Micronesia | 0.0 /100 | #305 | Tragic 7.0% |
| Iroquois | 0.0 /100 | #306 | Tragic 7.1% |
| Spanish Americans | 0.0 /100 | #307 | Tragic 7.1% |
| Chippewa | 0.0 /100 | #308 | Tragic 7.1% |
| Immigrants | Azores | 0.0 /100 | #309 | Tragic 7.1% |
| Arapaho | 0.0 /100 | #310 | Tragic 7.1% |
| Cree | 0.0 /100 | #311 | Tragic 7.1% |
| Delaware | 0.0 /100 | #312 | Tragic 7.1% |
| Immigrants | Yemen | 0.0 /100 | #313 | Tragic 7.1% |
| Blackfeet | 0.0 /100 | #314 | Tragic 7.1% |
| Shoshone | 0.0 /100 | #315 | Tragic 7.1% |
| Immigrants | Dominican Republic | 0.0 /100 | #316 | Tragic 7.1% |
| Central American Indians | 0.0 /100 | #317 | Tragic 7.2% |