Maltese vs Immigrants from Vietnam Hearing Disability
COMPARE
Maltese
Immigrants from Vietnam
Hearing Disability
Hearing Disability Comparison
Maltese
Immigrants from Vietnam
3.2%
HEARING DISABILITY
4.1/ 100
METRIC RATING
229th/ 347
METRIC RANK
2.9%
HEARING DISABILITY
86.5/ 100
METRIC RATING
130th/ 347
METRIC RANK
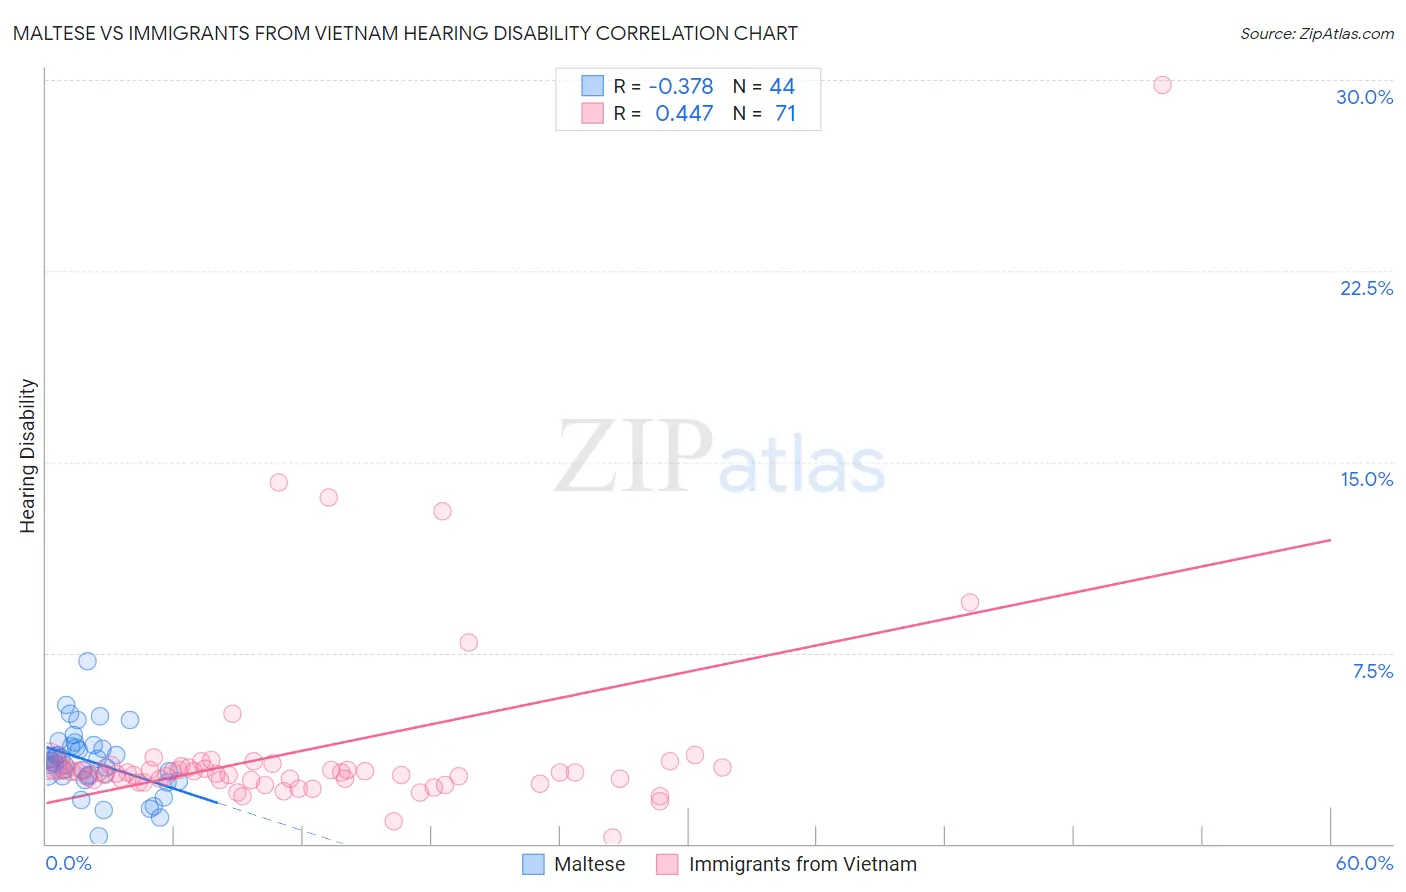
Maltese vs Immigrants from Vietnam Hearing Disability Correlation Chart
The statistical analysis conducted on geographies consisting of 126,465,579 people shows a mild negative correlation between the proportion of Maltese and percentage of population with hearing disability in the United States with a correlation coefficient (R) of -0.378 and weighted average of 3.2%. Similarly, the statistical analysis conducted on geographies consisting of 404,662,958 people shows a moderate positive correlation between the proportion of Immigrants from Vietnam and percentage of population with hearing disability in the United States with a correlation coefficient (R) of 0.447 and weighted average of 2.9%, a difference of 12.3%.
Hearing Disability Correlation Summary
| Measurement | Maltese | Immigrants from Vietnam |
| Minimum | 0.30% | 0.23% |
| Maximum | 7.2% | 29.8% |
| Range | 6.9% | 29.6% |
| Mean | 3.2% | 3.7% |
| Median | 3.2% | 2.8% |
| Interquartile 25% (IQ1) | 2.7% | 2.5% |
| Interquartile 75% (IQ3) | 3.8% | 3.0% |
| Interquartile Range (IQR) | 1.1% | 0.53% |
| Standard Deviation (Sample) | 1.3% | 4.0% |
| Standard Deviation (Population) | 1.2% | 4.0% |
Similar Demographics by Hearing Disability
Demographics Similar to Maltese by Hearing Disability
In terms of hearing disability, the demographic groups most similar to Maltese are Immigrants from Portugal (3.2%, a difference of 0.11%), Bhutanese (3.2%, a difference of 0.30%), Lebanese (3.2%, a difference of 0.49%), Greek (3.2%, a difference of 0.51%), and Latvian (3.2%, a difference of 0.53%).
| Demographics | Rating | Rank | Hearing Disability |
| Immigrants | Oceania | 6.5 /100 | #222 | Tragic 3.2% |
| Mexicans | 5.6 /100 | #223 | Tragic 3.2% |
| Icelanders | 5.2 /100 | #224 | Tragic 3.2% |
| Latvians | 5.1 /100 | #225 | Tragic 3.2% |
| Lebanese | 5.0 /100 | #226 | Tragic 3.2% |
| Bhutanese | 4.6 /100 | #227 | Tragic 3.2% |
| Immigrants | Portugal | 4.3 /100 | #228 | Tragic 3.2% |
| Maltese | 4.1 /100 | #229 | Tragic 3.2% |
| Greeks | 3.2 /100 | #230 | Tragic 3.2% |
| Luxembourgers | 2.9 /100 | #231 | Tragic 3.2% |
| Ukrainians | 2.9 /100 | #232 | Tragic 3.2% |
| Estonians | 2.4 /100 | #233 | Tragic 3.3% |
| Central American Indians | 2.3 /100 | #234 | Tragic 3.3% |
| Guamanians/Chamorros | 2.2 /100 | #235 | Tragic 3.3% |
| Serbians | 2.2 /100 | #236 | Tragic 3.3% |
Demographics Similar to Immigrants from Vietnam by Hearing Disability
In terms of hearing disability, the demographic groups most similar to Immigrants from Vietnam are Immigrants from Uganda (2.9%, a difference of 0.020%), South American Indian (2.9%, a difference of 0.070%), Immigrants from Western Asia (2.9%, a difference of 0.070%), Immigrants from Kenya (2.9%, a difference of 0.090%), and Chilean (2.9%, a difference of 0.14%).
| Demographics | Rating | Rank | Hearing Disability |
| Immigrants | Zaire | 88.6 /100 | #123 | Excellent 2.9% |
| Bahamians | 88.6 /100 | #124 | Excellent 2.9% |
| Immigrants | Albania | 88.5 /100 | #125 | Excellent 2.9% |
| Immigrants | Sudan | 87.8 /100 | #126 | Excellent 2.9% |
| South American Indians | 86.9 /100 | #127 | Excellent 2.9% |
| Immigrants | Western Asia | 86.9 /100 | #128 | Excellent 2.9% |
| Immigrants | Uganda | 86.6 /100 | #129 | Excellent 2.9% |
| Immigrants | Vietnam | 86.5 /100 | #130 | Excellent 2.9% |
| Immigrants | Kenya | 86.1 /100 | #131 | Excellent 2.9% |
| Chileans | 85.8 /100 | #132 | Excellent 2.9% |
| Immigrants | Syria | 85.8 /100 | #133 | Excellent 2.9% |
| Ugandans | 85.5 /100 | #134 | Excellent 2.9% |
| Soviet Union | 84.8 /100 | #135 | Excellent 2.9% |
| Immigrants | Brazil | 84.6 /100 | #136 | Excellent 2.9% |
| Sri Lankans | 84.1 /100 | #137 | Excellent 2.9% |