Maltese vs Paiute Hearing Disability
COMPARE
Maltese
Paiute
Hearing Disability
Hearing Disability Comparison
Maltese
Paiute
3.2%
HEARING DISABILITY
4.1/ 100
METRIC RATING
229th/ 347
METRIC RANK
4.1%
HEARING DISABILITY
0.0/ 100
METRIC RATING
321st/ 347
METRIC RANK
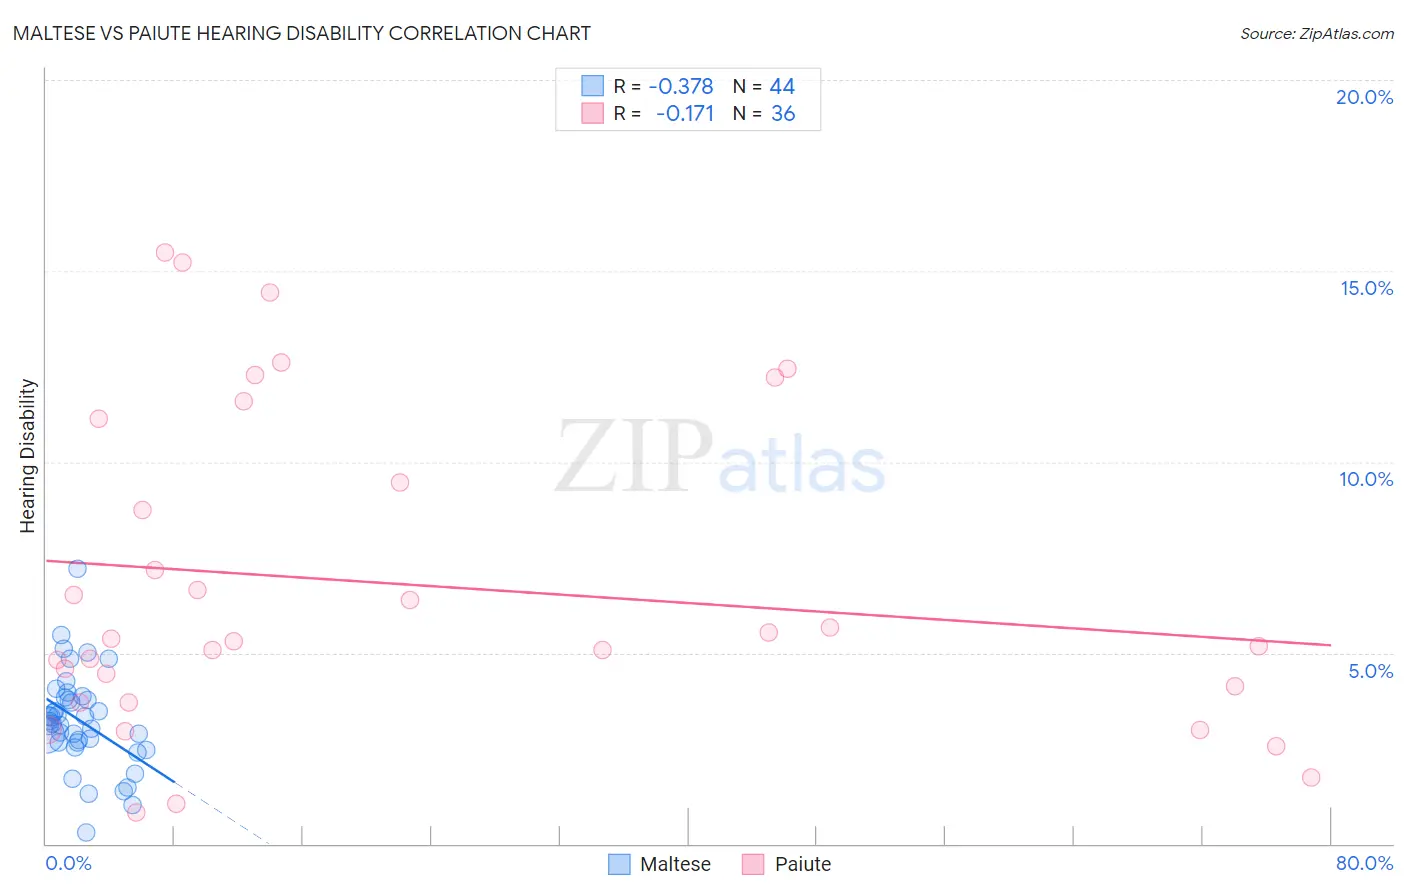
Maltese vs Paiute Hearing Disability Correlation Chart
The statistical analysis conducted on geographies consisting of 126,465,579 people shows a mild negative correlation between the proportion of Maltese and percentage of population with hearing disability in the United States with a correlation coefficient (R) of -0.378 and weighted average of 3.2%. Similarly, the statistical analysis conducted on geographies consisting of 58,392,251 people shows a poor negative correlation between the proportion of Paiute and percentage of population with hearing disability in the United States with a correlation coefficient (R) of -0.171 and weighted average of 4.1%, a difference of 26.7%.
Hearing Disability Correlation Summary
| Measurement | Maltese | Paiute |
| Minimum | 0.30% | 0.82% |
| Maximum | 7.2% | 15.5% |
| Range | 6.9% | 14.7% |
| Mean | 3.2% | 6.8% |
| Median | 3.2% | 5.3% |
| Interquartile 25% (IQ1) | 2.7% | 3.9% |
| Interquartile 75% (IQ3) | 3.8% | 10.3% |
| Interquartile Range (IQR) | 1.1% | 6.4% |
| Standard Deviation (Sample) | 1.3% | 4.1% |
| Standard Deviation (Population) | 1.2% | 4.1% |
Similar Demographics by Hearing Disability
Demographics Similar to Maltese by Hearing Disability
In terms of hearing disability, the demographic groups most similar to Maltese are Immigrants from Portugal (3.2%, a difference of 0.11%), Bhutanese (3.2%, a difference of 0.30%), Lebanese (3.2%, a difference of 0.49%), Greek (3.2%, a difference of 0.51%), and Latvian (3.2%, a difference of 0.53%).
| Demographics | Rating | Rank | Hearing Disability |
| Immigrants | Oceania | 6.5 /100 | #222 | Tragic 3.2% |
| Mexicans | 5.6 /100 | #223 | Tragic 3.2% |
| Icelanders | 5.2 /100 | #224 | Tragic 3.2% |
| Latvians | 5.1 /100 | #225 | Tragic 3.2% |
| Lebanese | 5.0 /100 | #226 | Tragic 3.2% |
| Bhutanese | 4.6 /100 | #227 | Tragic 3.2% |
| Immigrants | Portugal | 4.3 /100 | #228 | Tragic 3.2% |
| Maltese | 4.1 /100 | #229 | Tragic 3.2% |
| Greeks | 3.2 /100 | #230 | Tragic 3.2% |
| Luxembourgers | 2.9 /100 | #231 | Tragic 3.2% |
| Ukrainians | 2.9 /100 | #232 | Tragic 3.2% |
| Estonians | 2.4 /100 | #233 | Tragic 3.3% |
| Central American Indians | 2.3 /100 | #234 | Tragic 3.3% |
| Guamanians/Chamorros | 2.2 /100 | #235 | Tragic 3.3% |
| Serbians | 2.2 /100 | #236 | Tragic 3.3% |
Demographics Similar to Paiute by Hearing Disability
In terms of hearing disability, the demographic groups most similar to Paiute are Seminole (4.1%, a difference of 0.26%), Apache (4.1%, a difference of 0.38%), Osage (4.1%, a difference of 0.45%), Lumbee (4.1%, a difference of 0.77%), and Potawatomi (4.1%, a difference of 1.1%).
| Demographics | Rating | Rank | Hearing Disability |
| Yakama | 0.0 /100 | #314 | Tragic 3.9% |
| Puget Sound Salish | 0.0 /100 | #315 | Tragic 3.9% |
| Spanish Americans | 0.0 /100 | #316 | Tragic 4.0% |
| Comanche | 0.0 /100 | #317 | Tragic 4.0% |
| Cheyenne | 0.0 /100 | #318 | Tragic 4.0% |
| Chippewa | 0.0 /100 | #319 | Tragic 4.0% |
| Shoshone | 0.0 /100 | #320 | Tragic 4.0% |
| Paiute | 0.0 /100 | #321 | Tragic 4.1% |
| Seminole | 0.0 /100 | #322 | Tragic 4.1% |
| Apache | 0.0 /100 | #323 | Tragic 4.1% |
| Osage | 0.0 /100 | #324 | Tragic 4.1% |
| Lumbee | 0.0 /100 | #325 | Tragic 4.1% |
| Potawatomi | 0.0 /100 | #326 | Tragic 4.1% |
| Arapaho | 0.0 /100 | #327 | Tragic 4.1% |
| Tohono O'odham | 0.0 /100 | #328 | Tragic 4.2% |