Maltese vs Costa Rican Hearing Disability
COMPARE
Maltese
Costa Rican
Hearing Disability
Hearing Disability Comparison
Maltese
Costa Ricans
3.2%
HEARING DISABILITY
4.1/ 100
METRIC RATING
229th/ 347
METRIC RANK
2.9%
HEARING DISABILITY
71.4/ 100
METRIC RATING
155th/ 347
METRIC RANK
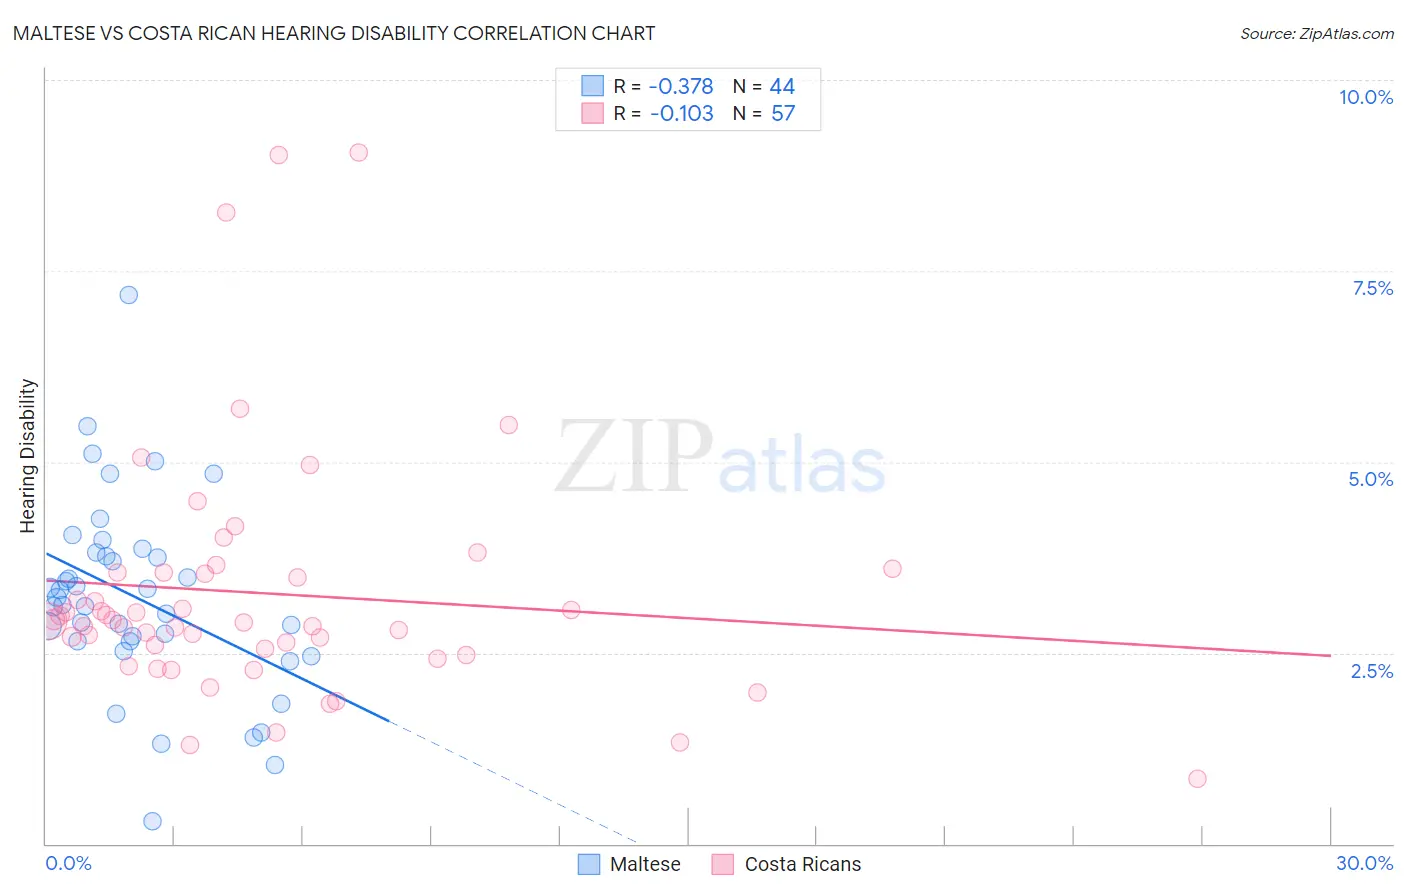
Maltese vs Costa Rican Hearing Disability Correlation Chart
The statistical analysis conducted on geographies consisting of 126,465,579 people shows a mild negative correlation between the proportion of Maltese and percentage of population with hearing disability in the United States with a correlation coefficient (R) of -0.378 and weighted average of 3.2%. Similarly, the statistical analysis conducted on geographies consisting of 253,538,538 people shows a poor negative correlation between the proportion of Costa Ricans and percentage of population with hearing disability in the United States with a correlation coefficient (R) of -0.103 and weighted average of 2.9%, a difference of 9.8%.
Hearing Disability Correlation Summary
| Measurement | Maltese | Costa Rican |
| Minimum | 0.30% | 0.86% |
| Maximum | 7.2% | 9.0% |
| Range | 6.9% | 8.2% |
| Mean | 3.2% | 3.3% |
| Median | 3.2% | 2.9% |
| Interquartile 25% (IQ1) | 2.7% | 2.5% |
| Interquartile 75% (IQ3) | 3.8% | 3.6% |
| Interquartile Range (IQR) | 1.1% | 1.0% |
| Standard Deviation (Sample) | 1.3% | 1.6% |
| Standard Deviation (Population) | 1.2% | 1.6% |
Similar Demographics by Hearing Disability
Demographics Similar to Maltese by Hearing Disability
In terms of hearing disability, the demographic groups most similar to Maltese are Immigrants from Portugal (3.2%, a difference of 0.11%), Bhutanese (3.2%, a difference of 0.30%), Lebanese (3.2%, a difference of 0.49%), Greek (3.2%, a difference of 0.51%), and Latvian (3.2%, a difference of 0.53%).
| Demographics | Rating | Rank | Hearing Disability |
| Immigrants | Oceania | 6.5 /100 | #222 | Tragic 3.2% |
| Mexicans | 5.6 /100 | #223 | Tragic 3.2% |
| Icelanders | 5.2 /100 | #224 | Tragic 3.2% |
| Latvians | 5.1 /100 | #225 | Tragic 3.2% |
| Lebanese | 5.0 /100 | #226 | Tragic 3.2% |
| Bhutanese | 4.6 /100 | #227 | Tragic 3.2% |
| Immigrants | Portugal | 4.3 /100 | #228 | Tragic 3.2% |
| Maltese | 4.1 /100 | #229 | Tragic 3.2% |
| Greeks | 3.2 /100 | #230 | Tragic 3.2% |
| Luxembourgers | 2.9 /100 | #231 | Tragic 3.2% |
| Ukrainians | 2.9 /100 | #232 | Tragic 3.2% |
| Estonians | 2.4 /100 | #233 | Tragic 3.3% |
| Central American Indians | 2.3 /100 | #234 | Tragic 3.3% |
| Guamanians/Chamorros | 2.2 /100 | #235 | Tragic 3.3% |
| Serbians | 2.2 /100 | #236 | Tragic 3.3% |
Demographics Similar to Costa Ricans by Hearing Disability
In terms of hearing disability, the demographic groups most similar to Costa Ricans are Immigrants from Lebanon (2.9%, a difference of 0.010%), Sudanese (2.9%, a difference of 0.090%), Immigrants from Poland (2.9%, a difference of 0.14%), Immigrants from Lithuania (2.9%, a difference of 0.19%), and Immigrants from France (2.9%, a difference of 0.21%).
| Demographics | Rating | Rank | Hearing Disability |
| Immigrants | Russia | 77.7 /100 | #148 | Good 2.9% |
| Immigrants | Panama | 76.9 /100 | #149 | Good 2.9% |
| Palestinians | 73.6 /100 | #150 | Good 2.9% |
| Immigrants | France | 73.1 /100 | #151 | Good 2.9% |
| Immigrants | Lithuania | 73.0 /100 | #152 | Good 2.9% |
| Sudanese | 72.1 /100 | #153 | Good 2.9% |
| Immigrants | Lebanon | 71.5 /100 | #154 | Good 2.9% |
| Costa Ricans | 71.4 /100 | #155 | Good 2.9% |
| Immigrants | Poland | 70.2 /100 | #156 | Good 2.9% |
| Immigrants | Kazakhstan | 69.6 /100 | #157 | Good 2.9% |
| Immigrants | Burma/Myanmar | 69.5 /100 | #158 | Good 2.9% |
| Immigrants | Australia | 67.4 /100 | #159 | Good 2.9% |
| Immigrants | Fiji | 67.1 /100 | #160 | Good 2.9% |
| Albanians | 66.6 /100 | #161 | Good 2.9% |
| Immigrants | Japan | 66.3 /100 | #162 | Good 2.9% |