Mongolian vs Trinidadian and Tobagonian Hearing Disability
COMPARE
Mongolian
Trinidadian and Tobagonian
Hearing Disability
Hearing Disability Comparison
Mongolians
Trinidadians and Tobagonians
2.7%
HEARING DISABILITY
97.4/ 100
METRIC RATING
78th/ 347
METRIC RANK
2.5%
HEARING DISABILITY
99.9/ 100
METRIC RATING
12th/ 347
METRIC RANK
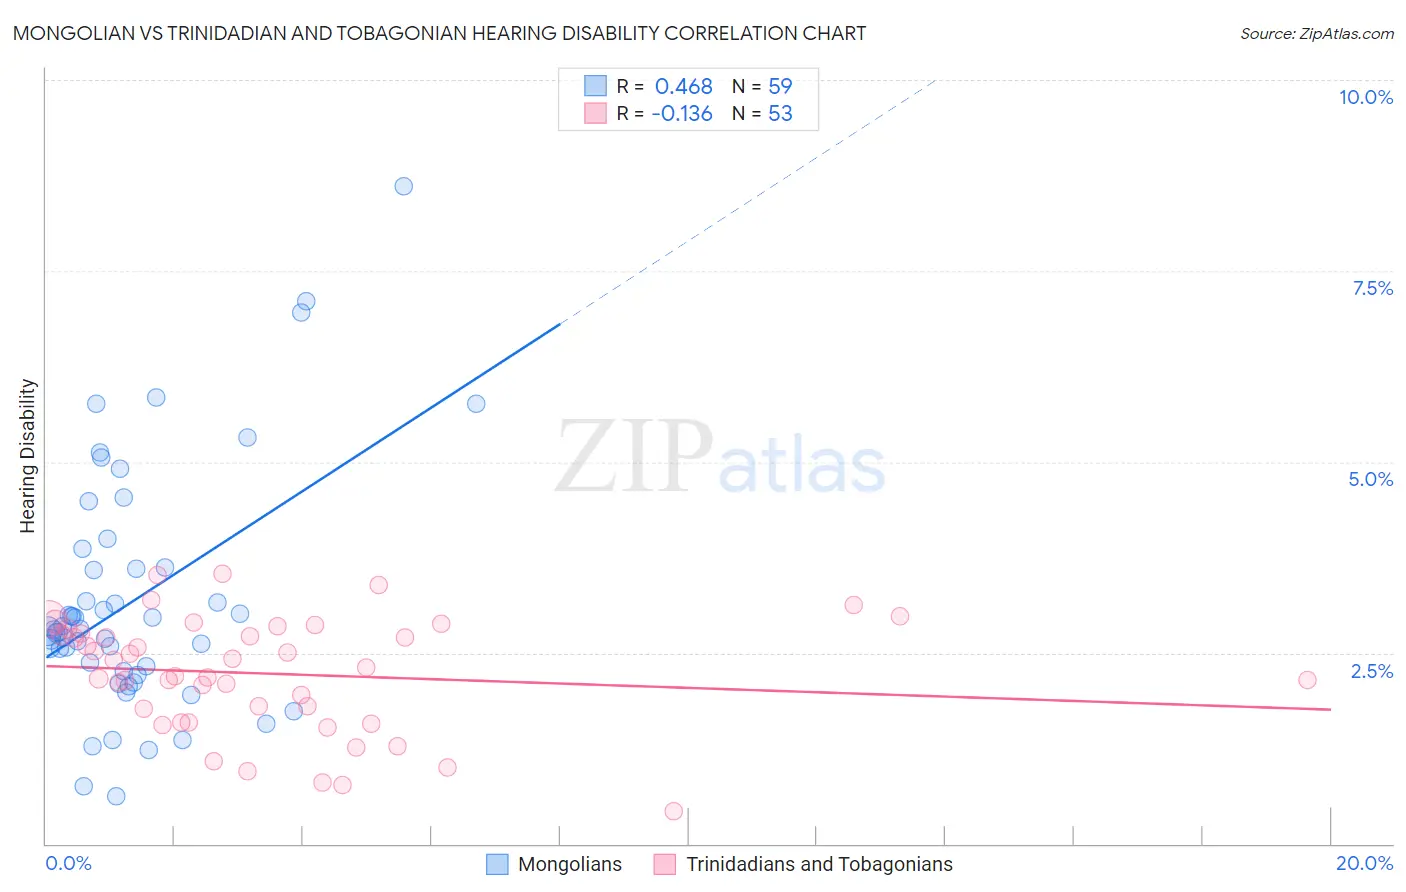
Mongolian vs Trinidadian and Tobagonian Hearing Disability Correlation Chart
The statistical analysis conducted on geographies consisting of 140,352,505 people shows a moderate positive correlation between the proportion of Mongolians and percentage of population with hearing disability in the United States with a correlation coefficient (R) of 0.468 and weighted average of 2.7%. Similarly, the statistical analysis conducted on geographies consisting of 219,769,787 people shows a poor negative correlation between the proportion of Trinidadians and Tobagonians and percentage of population with hearing disability in the United States with a correlation coefficient (R) of -0.136 and weighted average of 2.5%, a difference of 9.8%.
Hearing Disability Correlation Summary
| Measurement | Mongolian | Trinidadian and Tobagonian |
| Minimum | 0.63% | 0.42% |
| Maximum | 8.6% | 3.5% |
| Range | 8.0% | 3.1% |
| Mean | 3.2% | 2.2% |
| Median | 2.8% | 2.3% |
| Interquartile 25% (IQ1) | 2.3% | 1.7% |
| Interquartile 75% (IQ3) | 3.6% | 2.8% |
| Interquartile Range (IQR) | 1.4% | 1.1% |
| Standard Deviation (Sample) | 1.6% | 0.74% |
| Standard Deviation (Population) | 1.6% | 0.74% |
Similar Demographics by Hearing Disability
Demographics Similar to Mongolians by Hearing Disability
In terms of hearing disability, the demographic groups most similar to Mongolians are Colombian (2.7%, a difference of 0.020%), Immigrants from Malaysia (2.7%, a difference of 0.040%), Immigrants from Saudi Arabia (2.7%, a difference of 0.070%), Asian (2.7%, a difference of 0.070%), and Immigrants from Korea (2.7%, a difference of 0.090%).
| Demographics | Rating | Rank | Hearing Disability |
| Central Americans | 97.7 /100 | #71 | Exceptional 2.7% |
| Afghans | 97.6 /100 | #72 | Exceptional 2.7% |
| Argentineans | 97.5 /100 | #73 | Exceptional 2.7% |
| Immigrants | Korea | 97.5 /100 | #74 | Exceptional 2.7% |
| Immigrants | Saudi Arabia | 97.5 /100 | #75 | Exceptional 2.7% |
| Asians | 97.5 /100 | #76 | Exceptional 2.7% |
| Immigrants | Malaysia | 97.5 /100 | #77 | Exceptional 2.7% |
| Mongolians | 97.4 /100 | #78 | Exceptional 2.7% |
| Colombians | 97.4 /100 | #79 | Exceptional 2.7% |
| Immigrants | Asia | 97.2 /100 | #80 | Exceptional 2.7% |
| Immigrants | Uruguay | 97.2 /100 | #81 | Exceptional 2.7% |
| Immigrants | Armenia | 97.2 /100 | #82 | Exceptional 2.7% |
| Immigrants | Cuba | 97.2 /100 | #83 | Exceptional 2.7% |
| Immigrants | Argentina | 97.0 /100 | #84 | Exceptional 2.8% |
| Immigrants | Northern Africa | 96.9 /100 | #85 | Exceptional 2.8% |
Demographics Similar to Trinidadians and Tobagonians by Hearing Disability
In terms of hearing disability, the demographic groups most similar to Trinidadians and Tobagonians are Sierra Leonean (2.5%, a difference of 0.22%), Immigrants from Trinidad and Tobago (2.5%, a difference of 0.30%), Ecuadorian (2.5%, a difference of 0.54%), Barbadian (2.5%, a difference of 0.85%), and Immigrants from Ecuador (2.5%, a difference of 0.86%).
| Demographics | Rating | Rank | Hearing Disability |
| Immigrants | Barbados | 100.0 /100 | #5 | Exceptional 2.4% |
| Vietnamese | 100.0 /100 | #6 | Exceptional 2.4% |
| Immigrants | Bangladesh | 100.0 /100 | #7 | Exceptional 2.4% |
| British West Indians | 100.0 /100 | #8 | Exceptional 2.4% |
| Immigrants | Dominican Republic | 100.0 /100 | #9 | Exceptional 2.4% |
| Immigrants | Ecuador | 99.9 /100 | #10 | Exceptional 2.5% |
| Immigrants | Trinidad and Tobago | 99.9 /100 | #11 | Exceptional 2.5% |
| Trinidadians and Tobagonians | 99.9 /100 | #12 | Exceptional 2.5% |
| Sierra Leoneans | 99.9 /100 | #13 | Exceptional 2.5% |
| Ecuadorians | 99.9 /100 | #14 | Exceptional 2.5% |
| Barbadians | 99.9 /100 | #15 | Exceptional 2.5% |
| Immigrants | West Indies | 99.9 /100 | #16 | Exceptional 2.5% |
| Immigrants | India | 99.9 /100 | #17 | Exceptional 2.5% |
| Dominicans | 99.8 /100 | #18 | Exceptional 2.5% |
| Thais | 99.8 /100 | #19 | Exceptional 2.5% |