Immigrants from Middle Africa vs Trinidadian and Tobagonian Hearing Disability
COMPARE
Immigrants from Middle Africa
Trinidadian and Tobagonian
Hearing Disability
Hearing Disability Comparison
Immigrants from Middle Africa
Trinidadians and Tobagonians
2.8%
HEARING DISABILITY
96.5/ 100
METRIC RATING
91st/ 347
METRIC RANK
2.5%
HEARING DISABILITY
99.9/ 100
METRIC RATING
12th/ 347
METRIC RANK
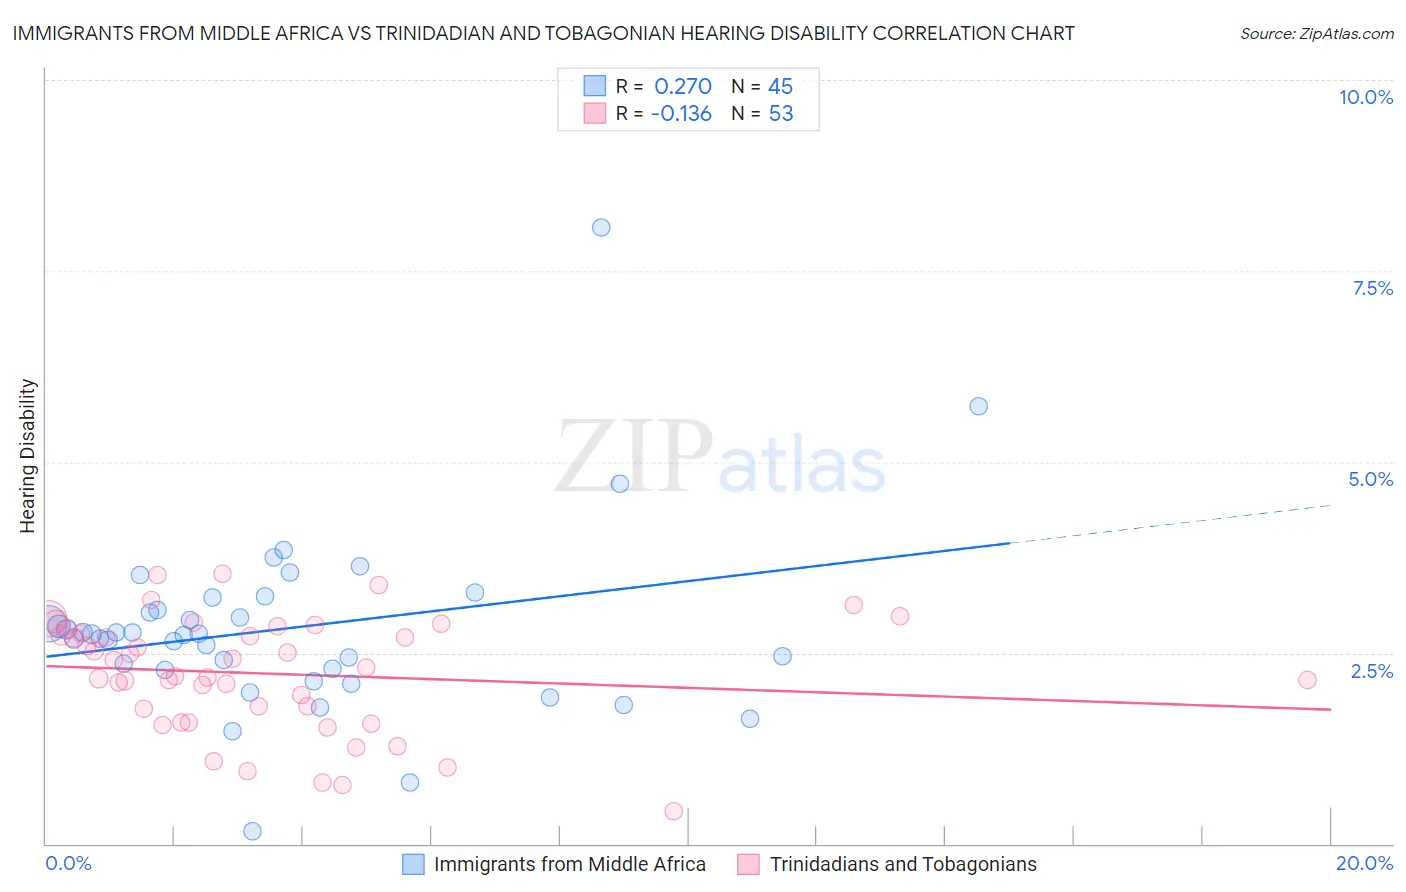
Immigrants from Middle Africa vs Trinidadian and Tobagonian Hearing Disability Correlation Chart
The statistical analysis conducted on geographies consisting of 202,695,899 people shows a weak positive correlation between the proportion of Immigrants from Middle Africa and percentage of population with hearing disability in the United States with a correlation coefficient (R) of 0.270 and weighted average of 2.8%. Similarly, the statistical analysis conducted on geographies consisting of 219,769,787 people shows a poor negative correlation between the proportion of Trinidadians and Tobagonians and percentage of population with hearing disability in the United States with a correlation coefficient (R) of -0.136 and weighted average of 2.5%, a difference of 10.7%.
Hearing Disability Correlation Summary
| Measurement | Immigrants from Middle Africa | Trinidadian and Tobagonian |
| Minimum | 0.16% | 0.42% |
| Maximum | 8.1% | 3.5% |
| Range | 7.9% | 3.1% |
| Mean | 2.8% | 2.2% |
| Median | 2.7% | 2.3% |
| Interquartile 25% (IQ1) | 2.3% | 1.7% |
| Interquartile 75% (IQ3) | 3.1% | 2.8% |
| Interquartile Range (IQR) | 0.87% | 1.1% |
| Standard Deviation (Sample) | 1.2% | 0.74% |
| Standard Deviation (Population) | 1.2% | 0.74% |
Similar Demographics by Hearing Disability
Demographics Similar to Immigrants from Middle Africa by Hearing Disability
In terms of hearing disability, the demographic groups most similar to Immigrants from Middle Africa are Iranian (2.8%, a difference of 0.030%), Immigrants from Morocco (2.8%, a difference of 0.080%), Belizean (2.8%, a difference of 0.11%), Immigrants from Turkey (2.8%, a difference of 0.13%), and Immigrants from Kuwait (2.8%, a difference of 0.15%).
| Demographics | Rating | Rank | Hearing Disability |
| Immigrants | Argentina | 97.0 /100 | #84 | Exceptional 2.8% |
| Immigrants | Northern Africa | 96.9 /100 | #85 | Exceptional 2.8% |
| Immigrants | Iran | 96.8 /100 | #86 | Exceptional 2.8% |
| Somalis | 96.7 /100 | #87 | Exceptional 2.8% |
| Immigrants | Turkey | 96.7 /100 | #88 | Exceptional 2.8% |
| Belizeans | 96.6 /100 | #89 | Exceptional 2.8% |
| Immigrants | Morocco | 96.6 /100 | #90 | Exceptional 2.8% |
| Immigrants | Middle Africa | 96.5 /100 | #91 | Exceptional 2.8% |
| Iranians | 96.4 /100 | #92 | Exceptional 2.8% |
| Immigrants | Kuwait | 96.3 /100 | #93 | Exceptional 2.8% |
| Uruguayans | 95.9 /100 | #94 | Exceptional 2.8% |
| Israelis | 95.9 /100 | #95 | Exceptional 2.8% |
| Immigrants | Somalia | 95.5 /100 | #96 | Exceptional 2.8% |
| Immigrants | Afghanistan | 95.3 /100 | #97 | Exceptional 2.8% |
| Immigrants | Honduras | 95.1 /100 | #98 | Exceptional 2.8% |
Demographics Similar to Trinidadians and Tobagonians by Hearing Disability
In terms of hearing disability, the demographic groups most similar to Trinidadians and Tobagonians are Sierra Leonean (2.5%, a difference of 0.22%), Immigrants from Trinidad and Tobago (2.5%, a difference of 0.30%), Ecuadorian (2.5%, a difference of 0.54%), Barbadian (2.5%, a difference of 0.85%), and Immigrants from Ecuador (2.5%, a difference of 0.86%).
| Demographics | Rating | Rank | Hearing Disability |
| Immigrants | Barbados | 100.0 /100 | #5 | Exceptional 2.4% |
| Vietnamese | 100.0 /100 | #6 | Exceptional 2.4% |
| Immigrants | Bangladesh | 100.0 /100 | #7 | Exceptional 2.4% |
| British West Indians | 100.0 /100 | #8 | Exceptional 2.4% |
| Immigrants | Dominican Republic | 100.0 /100 | #9 | Exceptional 2.4% |
| Immigrants | Ecuador | 99.9 /100 | #10 | Exceptional 2.5% |
| Immigrants | Trinidad and Tobago | 99.9 /100 | #11 | Exceptional 2.5% |
| Trinidadians and Tobagonians | 99.9 /100 | #12 | Exceptional 2.5% |
| Sierra Leoneans | 99.9 /100 | #13 | Exceptional 2.5% |
| Ecuadorians | 99.9 /100 | #14 | Exceptional 2.5% |
| Barbadians | 99.9 /100 | #15 | Exceptional 2.5% |
| Immigrants | West Indies | 99.9 /100 | #16 | Exceptional 2.5% |
| Immigrants | India | 99.9 /100 | #17 | Exceptional 2.5% |
| Dominicans | 99.8 /100 | #18 | Exceptional 2.5% |
| Thais | 99.8 /100 | #19 | Exceptional 2.5% |