Marshallese vs Trinidadian and Tobagonian Hearing Disability
COMPARE
Marshallese
Trinidadian and Tobagonian
Hearing Disability
Hearing Disability Comparison
Marshallese
Trinidadians and Tobagonians
3.8%
HEARING DISABILITY
0.0/ 100
METRIC RATING
306th/ 347
METRIC RANK
2.5%
HEARING DISABILITY
99.9/ 100
METRIC RATING
12th/ 347
METRIC RANK
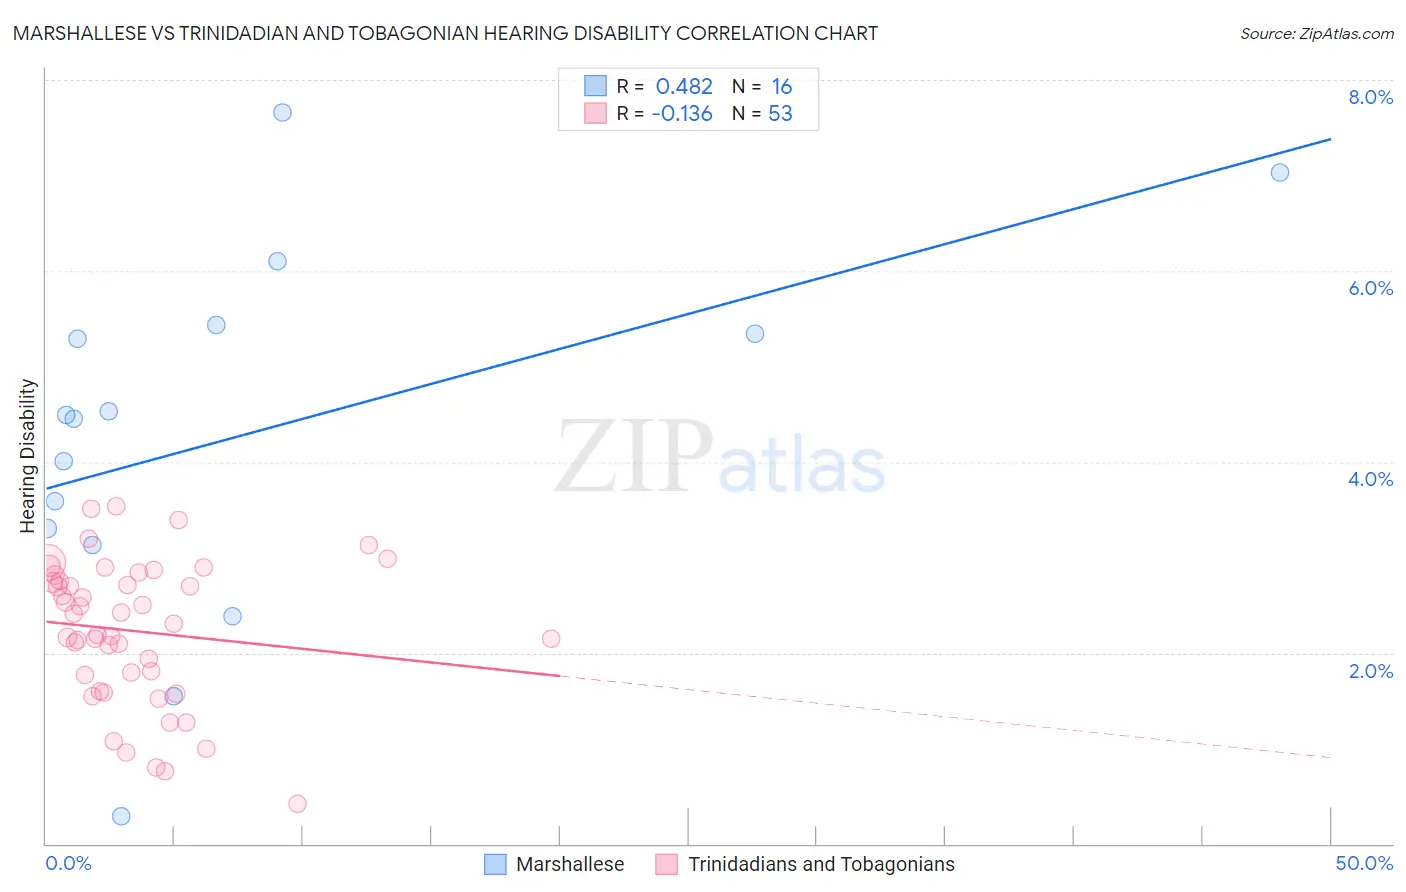
Marshallese vs Trinidadian and Tobagonian Hearing Disability Correlation Chart
The statistical analysis conducted on geographies consisting of 14,761,315 people shows a moderate positive correlation between the proportion of Marshallese and percentage of population with hearing disability in the United States with a correlation coefficient (R) of 0.482 and weighted average of 3.8%. Similarly, the statistical analysis conducted on geographies consisting of 219,769,787 people shows a poor negative correlation between the proportion of Trinidadians and Tobagonians and percentage of population with hearing disability in the United States with a correlation coefficient (R) of -0.136 and weighted average of 2.5%, a difference of 52.6%.
Hearing Disability Correlation Summary
| Measurement | Marshallese | Trinidadian and Tobagonian |
| Minimum | 0.29% | 0.42% |
| Maximum | 7.7% | 3.5% |
| Range | 7.4% | 3.1% |
| Mean | 4.3% | 2.2% |
| Median | 4.5% | 2.3% |
| Interquartile 25% (IQ1) | 3.2% | 1.7% |
| Interquartile 75% (IQ3) | 5.4% | 2.8% |
| Interquartile Range (IQR) | 2.2% | 1.1% |
| Standard Deviation (Sample) | 1.9% | 0.74% |
| Standard Deviation (Population) | 1.9% | 0.74% |
Similar Demographics by Hearing Disability
Demographics Similar to Marshallese by Hearing Disability
In terms of hearing disability, the demographic groups most similar to Marshallese are French Canadian (3.8%, a difference of 0.12%), Ottawa (3.8%, a difference of 0.56%), Scotch-Irish (3.8%, a difference of 0.64%), English (3.8%, a difference of 0.86%), and Cree (3.8%, a difference of 0.95%).
| Demographics | Rating | Rank | Hearing Disability |
| Germans | 0.0 /100 | #299 | Tragic 3.7% |
| Scottish | 0.0 /100 | #300 | Tragic 3.7% |
| Pennsylvania Germans | 0.0 /100 | #301 | Tragic 3.7% |
| Dutch | 0.0 /100 | #302 | Tragic 3.7% |
| Menominee | 0.0 /100 | #303 | Tragic 3.7% |
| French | 0.0 /100 | #304 | Tragic 3.8% |
| English | 0.0 /100 | #305 | Tragic 3.8% |
| Marshallese | 0.0 /100 | #306 | Tragic 3.8% |
| French Canadians | 0.0 /100 | #307 | Tragic 3.8% |
| Ottawa | 0.0 /100 | #308 | Tragic 3.8% |
| Scotch-Irish | 0.0 /100 | #309 | Tragic 3.8% |
| Cree | 0.0 /100 | #310 | Tragic 3.8% |
| Americans | 0.0 /100 | #311 | Tragic 3.9% |
| Cajuns | 0.0 /100 | #312 | Tragic 3.9% |
| Hopi | 0.0 /100 | #313 | Tragic 3.9% |
Demographics Similar to Trinidadians and Tobagonians by Hearing Disability
In terms of hearing disability, the demographic groups most similar to Trinidadians and Tobagonians are Sierra Leonean (2.5%, a difference of 0.22%), Immigrants from Trinidad and Tobago (2.5%, a difference of 0.30%), Ecuadorian (2.5%, a difference of 0.54%), Barbadian (2.5%, a difference of 0.85%), and Immigrants from Ecuador (2.5%, a difference of 0.86%).
| Demographics | Rating | Rank | Hearing Disability |
| Immigrants | Barbados | 100.0 /100 | #5 | Exceptional 2.4% |
| Vietnamese | 100.0 /100 | #6 | Exceptional 2.4% |
| Immigrants | Bangladesh | 100.0 /100 | #7 | Exceptional 2.4% |
| British West Indians | 100.0 /100 | #8 | Exceptional 2.4% |
| Immigrants | Dominican Republic | 100.0 /100 | #9 | Exceptional 2.4% |
| Immigrants | Ecuador | 99.9 /100 | #10 | Exceptional 2.5% |
| Immigrants | Trinidad and Tobago | 99.9 /100 | #11 | Exceptional 2.5% |
| Trinidadians and Tobagonians | 99.9 /100 | #12 | Exceptional 2.5% |
| Sierra Leoneans | 99.9 /100 | #13 | Exceptional 2.5% |
| Ecuadorians | 99.9 /100 | #14 | Exceptional 2.5% |
| Barbadians | 99.9 /100 | #15 | Exceptional 2.5% |
| Immigrants | West Indies | 99.9 /100 | #16 | Exceptional 2.5% |
| Immigrants | India | 99.9 /100 | #17 | Exceptional 2.5% |
| Dominicans | 99.8 /100 | #18 | Exceptional 2.5% |
| Thais | 99.8 /100 | #19 | Exceptional 2.5% |