Maltese vs Delaware Disability Age Under 5
COMPARE
Maltese
Delaware
Disability Age Under 5
Disability Age Under 5 Comparison
Maltese
Delaware
1.3%
DISABILITY AGE UNDER 5
2.2/ 100
METRIC RATING
241st/ 347
METRIC RANK
1.5%
DISABILITY AGE UNDER 5
0.0/ 100
METRIC RATING
283rd/ 347
METRIC RANK
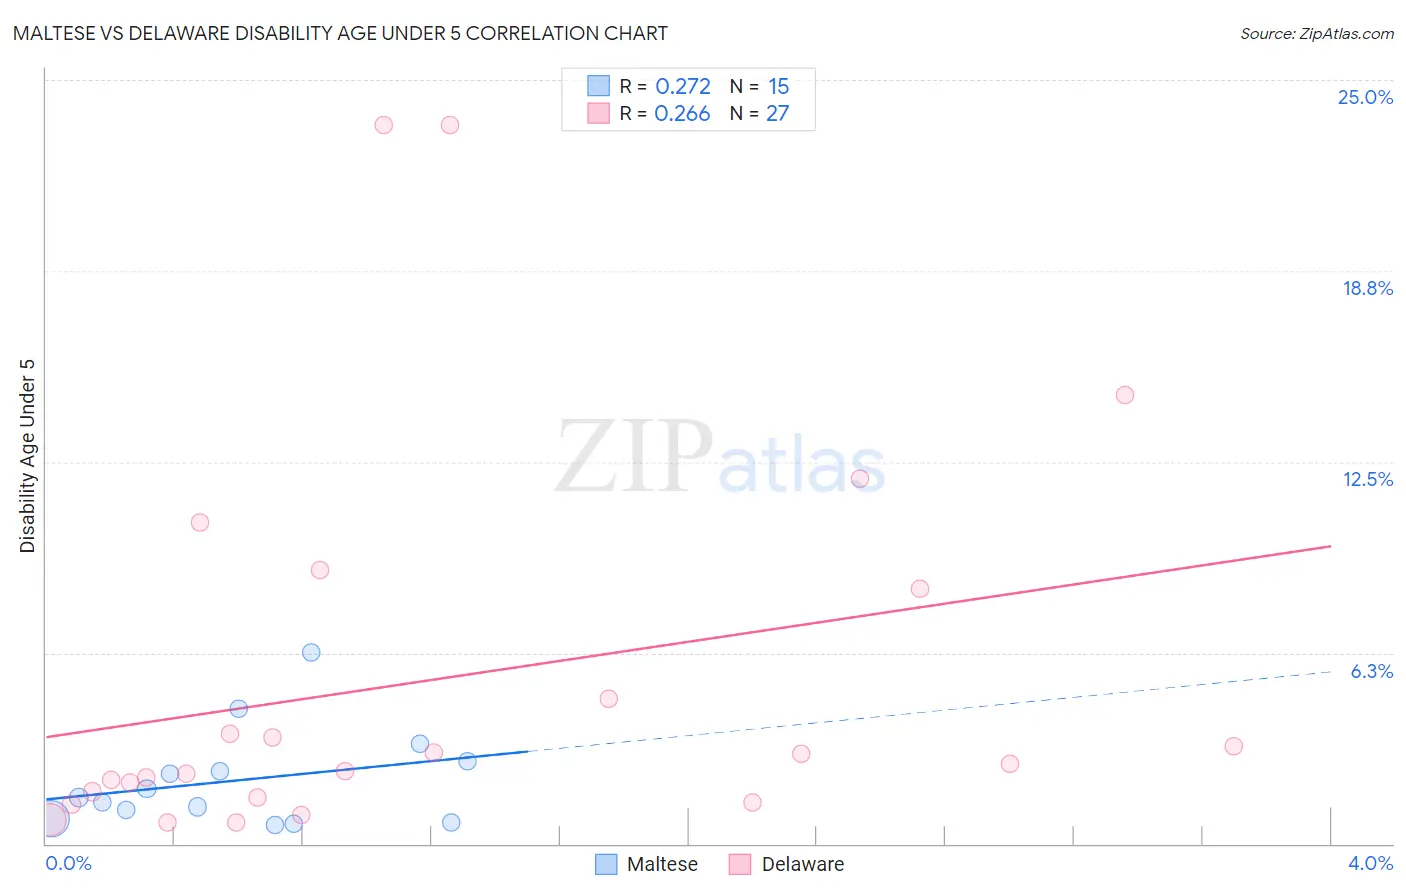
Maltese vs Delaware Disability Age Under 5 Correlation Chart
The statistical analysis conducted on geographies consisting of 87,586,086 people shows a weak positive correlation between the proportion of Maltese and percentage of population with a disability under the age of 5 in the United States with a correlation coefficient (R) of 0.272 and weighted average of 1.3%. Similarly, the statistical analysis conducted on geographies consisting of 72,236,656 people shows a weak positive correlation between the proportion of Delaware and percentage of population with a disability under the age of 5 in the United States with a correlation coefficient (R) of 0.266 and weighted average of 1.5%, a difference of 12.9%.
Disability Age Under 5 Correlation Summary
| Measurement | Maltese | Delaware |
| Minimum | 0.63% | 0.70% |
| Maximum | 6.3% | 23.5% |
| Range | 5.6% | 22.8% |
| Mean | 2.1% | 5.4% |
| Median | 1.5% | 2.6% |
| Interquartile 25% (IQ1) | 0.83% | 1.5% |
| Interquartile 75% (IQ3) | 2.7% | 8.3% |
| Interquartile Range (IQR) | 1.9% | 6.8% |
| Standard Deviation (Sample) | 1.6% | 6.4% |
| Standard Deviation (Population) | 1.5% | 6.3% |
Similar Demographics by Disability Age Under 5
Demographics Similar to Maltese by Disability Age Under 5
In terms of disability age under 5, the demographic groups most similar to Maltese are Native Hawaiian (1.3%, a difference of 0.070%), Lumbee (1.3%, a difference of 0.080%), Immigrants from Austria (1.3%, a difference of 0.090%), Spanish American Indian (1.3%, a difference of 0.25%), and Immigrants from Cameroon (1.4%, a difference of 0.46%).
| Demographics | Rating | Rank | Disability Age Under 5 |
| Pueblo | 3.8 /100 | #234 | Tragic 1.3% |
| Central American Indians | 3.6 /100 | #235 | Tragic 1.3% |
| South American Indians | 3.3 /100 | #236 | Tragic 1.3% |
| Basques | 3.0 /100 | #237 | Tragic 1.3% |
| Spanish American Indians | 2.4 /100 | #238 | Tragic 1.3% |
| Immigrants | Austria | 2.3 /100 | #239 | Tragic 1.3% |
| Native Hawaiians | 2.2 /100 | #240 | Tragic 1.3% |
| Maltese | 2.2 /100 | #241 | Tragic 1.3% |
| Lumbee | 2.1 /100 | #242 | Tragic 1.3% |
| Immigrants | Cameroon | 1.7 /100 | #243 | Tragic 1.4% |
| Spaniards | 1.4 /100 | #244 | Tragic 1.4% |
| Potawatomi | 1.1 /100 | #245 | Tragic 1.4% |
| Russians | 1.0 /100 | #246 | Tragic 1.4% |
| Immigrants | England | 1.0 /100 | #247 | Tragic 1.4% |
| Eastern Europeans | 1.0 /100 | #248 | Tragic 1.4% |
Demographics Similar to Delaware by Disability Age Under 5
In terms of disability age under 5, the demographic groups most similar to Delaware are European (1.5%, a difference of 0.050%), Cheyenne (1.5%, a difference of 0.19%), Czechoslovakian (1.5%, a difference of 0.54%), Croatian (1.5%, a difference of 1.2%), and Tlingit-Haida (1.5%, a difference of 1.5%).
| Demographics | Rating | Rank | Disability Age Under 5 |
| Greeks | 0.0 /100 | #276 | Tragic 1.5% |
| Canadians | 0.0 /100 | #277 | Tragic 1.5% |
| Kiowa | 0.0 /100 | #278 | Tragic 1.5% |
| Danes | 0.0 /100 | #279 | Tragic 1.5% |
| British | 0.0 /100 | #280 | Tragic 1.5% |
| Czechoslovakians | 0.0 /100 | #281 | Tragic 1.5% |
| Cheyenne | 0.0 /100 | #282 | Tragic 1.5% |
| Delaware | 0.0 /100 | #283 | Tragic 1.5% |
| Europeans | 0.0 /100 | #284 | Tragic 1.5% |
| Croatians | 0.0 /100 | #285 | Tragic 1.5% |
| Tlingit-Haida | 0.0 /100 | #286 | Tragic 1.5% |
| Scandinavians | 0.0 /100 | #287 | Tragic 1.5% |
| Estonians | 0.0 /100 | #288 | Tragic 1.5% |
| Hungarians | 0.0 /100 | #289 | Tragic 1.5% |
| Czechs | 0.0 /100 | #290 | Tragic 1.5% |