Maltese vs Immigrants from Italy Disability Age Under 5
COMPARE
Maltese
Immigrants from Italy
Disability Age Under 5
Disability Age Under 5 Comparison
Maltese
Immigrants from Italy
1.3%
DISABILITY AGE UNDER 5
2.2/ 100
METRIC RATING
241st/ 347
METRIC RANK
1.3%
DISABILITY AGE UNDER 5
25.4/ 100
METRIC RATING
201st/ 347
METRIC RANK
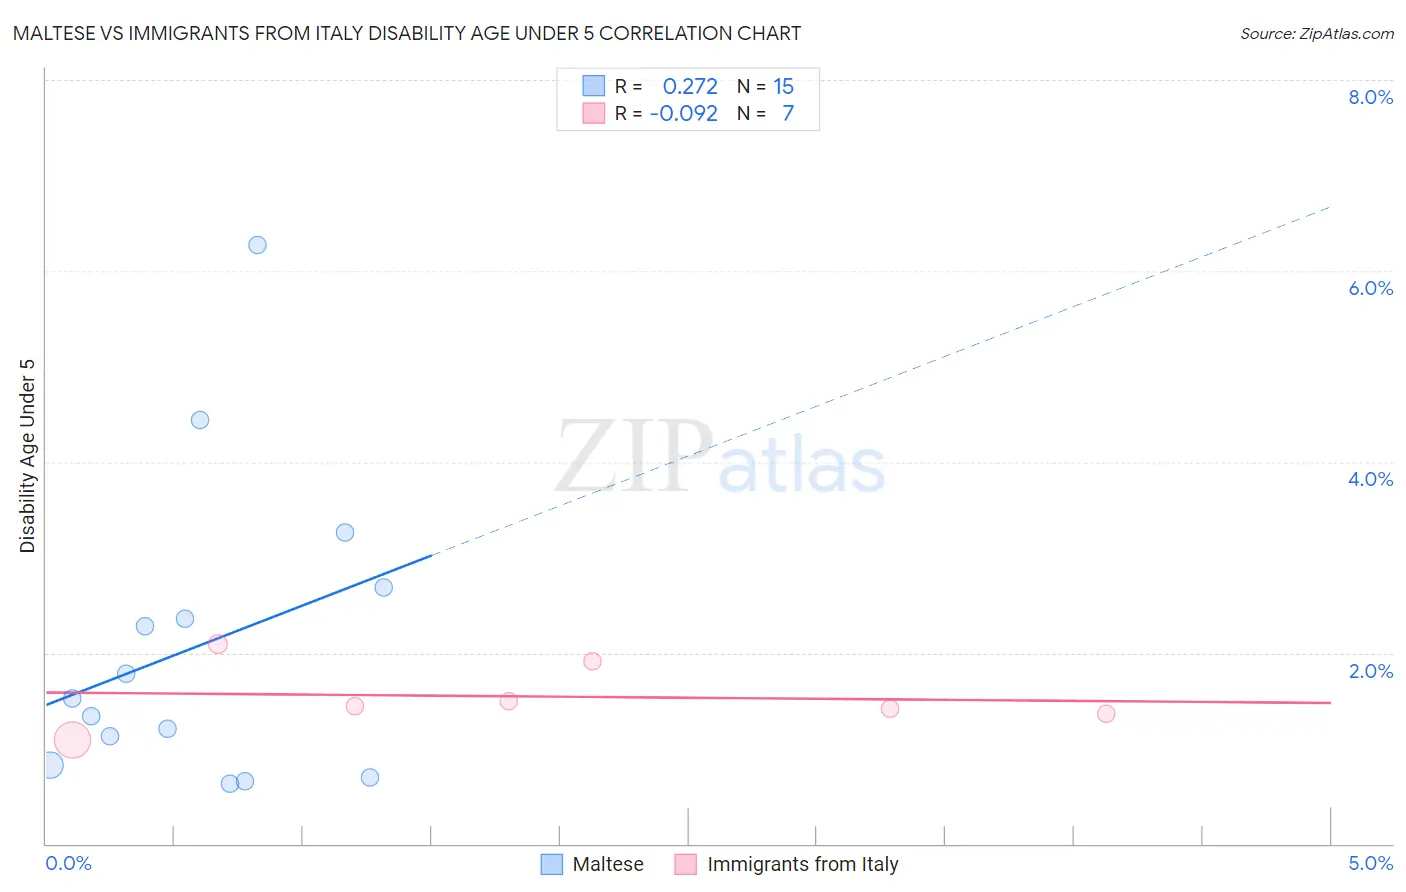
Maltese vs Immigrants from Italy Disability Age Under 5 Correlation Chart
The statistical analysis conducted on geographies consisting of 87,586,086 people shows a weak positive correlation between the proportion of Maltese and percentage of population with a disability under the age of 5 in the United States with a correlation coefficient (R) of 0.272 and weighted average of 1.3%. Similarly, the statistical analysis conducted on geographies consisting of 181,565,904 people shows a slight negative correlation between the proportion of Immigrants from Italy and percentage of population with a disability under the age of 5 in the United States with a correlation coefficient (R) of -0.092 and weighted average of 1.3%, a difference of 6.0%.
Disability Age Under 5 Correlation Summary
| Measurement | Maltese | Immigrants from Italy |
| Minimum | 0.63% | 1.1% |
| Maximum | 6.3% | 2.1% |
| Range | 5.6% | 1.0% |
| Mean | 2.1% | 1.5% |
| Median | 1.5% | 1.4% |
| Interquartile 25% (IQ1) | 0.83% | 1.4% |
| Interquartile 75% (IQ3) | 2.7% | 1.9% |
| Interquartile Range (IQR) | 1.9% | 0.54% |
| Standard Deviation (Sample) | 1.6% | 0.34% |
| Standard Deviation (Population) | 1.5% | 0.32% |
Similar Demographics by Disability Age Under 5
Demographics Similar to Maltese by Disability Age Under 5
In terms of disability age under 5, the demographic groups most similar to Maltese are Native Hawaiian (1.3%, a difference of 0.070%), Lumbee (1.3%, a difference of 0.080%), Immigrants from Austria (1.3%, a difference of 0.090%), Spanish American Indian (1.3%, a difference of 0.25%), and Immigrants from Cameroon (1.4%, a difference of 0.46%).
| Demographics | Rating | Rank | Disability Age Under 5 |
| Pueblo | 3.8 /100 | #234 | Tragic 1.3% |
| Central American Indians | 3.6 /100 | #235 | Tragic 1.3% |
| South American Indians | 3.3 /100 | #236 | Tragic 1.3% |
| Basques | 3.0 /100 | #237 | Tragic 1.3% |
| Spanish American Indians | 2.4 /100 | #238 | Tragic 1.3% |
| Immigrants | Austria | 2.3 /100 | #239 | Tragic 1.3% |
| Native Hawaiians | 2.2 /100 | #240 | Tragic 1.3% |
| Maltese | 2.2 /100 | #241 | Tragic 1.3% |
| Lumbee | 2.1 /100 | #242 | Tragic 1.3% |
| Immigrants | Cameroon | 1.7 /100 | #243 | Tragic 1.4% |
| Spaniards | 1.4 /100 | #244 | Tragic 1.4% |
| Potawatomi | 1.1 /100 | #245 | Tragic 1.4% |
| Russians | 1.0 /100 | #246 | Tragic 1.4% |
| Immigrants | England | 1.0 /100 | #247 | Tragic 1.4% |
| Eastern Europeans | 1.0 /100 | #248 | Tragic 1.4% |
Demographics Similar to Immigrants from Italy by Disability Age Under 5
In terms of disability age under 5, the demographic groups most similar to Immigrants from Italy are Arapaho (1.3%, a difference of 0.15%), Liberian (1.3%, a difference of 0.16%), Immigrants from Lithuania (1.3%, a difference of 0.20%), Immigrants from Europe (1.3%, a difference of 0.21%), and Romanian (1.3%, a difference of 0.34%).
| Demographics | Rating | Rank | Disability Age Under 5 |
| Immigrants | North Macedonia | 34.7 /100 | #194 | Fair 1.3% |
| U.S. Virgin Islanders | 34.4 /100 | #195 | Fair 1.3% |
| Immigrants | Belgium | 31.4 /100 | #196 | Fair 1.3% |
| Immigrants | Somalia | 31.3 /100 | #197 | Fair 1.3% |
| Immigrants | Norway | 31.1 /100 | #198 | Fair 1.3% |
| Jamaicans | 30.7 /100 | #199 | Fair 1.3% |
| Immigrants | Lithuania | 27.2 /100 | #200 | Fair 1.3% |
| Immigrants | Italy | 25.4 /100 | #201 | Fair 1.3% |
| Arapaho | 24.1 /100 | #202 | Fair 1.3% |
| Liberians | 24.0 /100 | #203 | Fair 1.3% |
| Immigrants | Europe | 23.6 /100 | #204 | Fair 1.3% |
| Romanians | 22.5 /100 | #205 | Fair 1.3% |
| Immigrants | Poland | 22.4 /100 | #206 | Fair 1.3% |
| Nigerians | 21.2 /100 | #207 | Fair 1.3% |
| Mexicans | 20.8 /100 | #208 | Fair 1.3% |