Albanian vs Delaware Disability Age Under 5
COMPARE
Albanian
Delaware
Disability Age Under 5
Disability Age Under 5 Comparison
Albanians
Delaware
1.1%
DISABILITY AGE UNDER 5
97.2/ 100
METRIC RATING
91st/ 347
METRIC RANK
1.5%
DISABILITY AGE UNDER 5
0.0/ 100
METRIC RATING
283rd/ 347
METRIC RANK
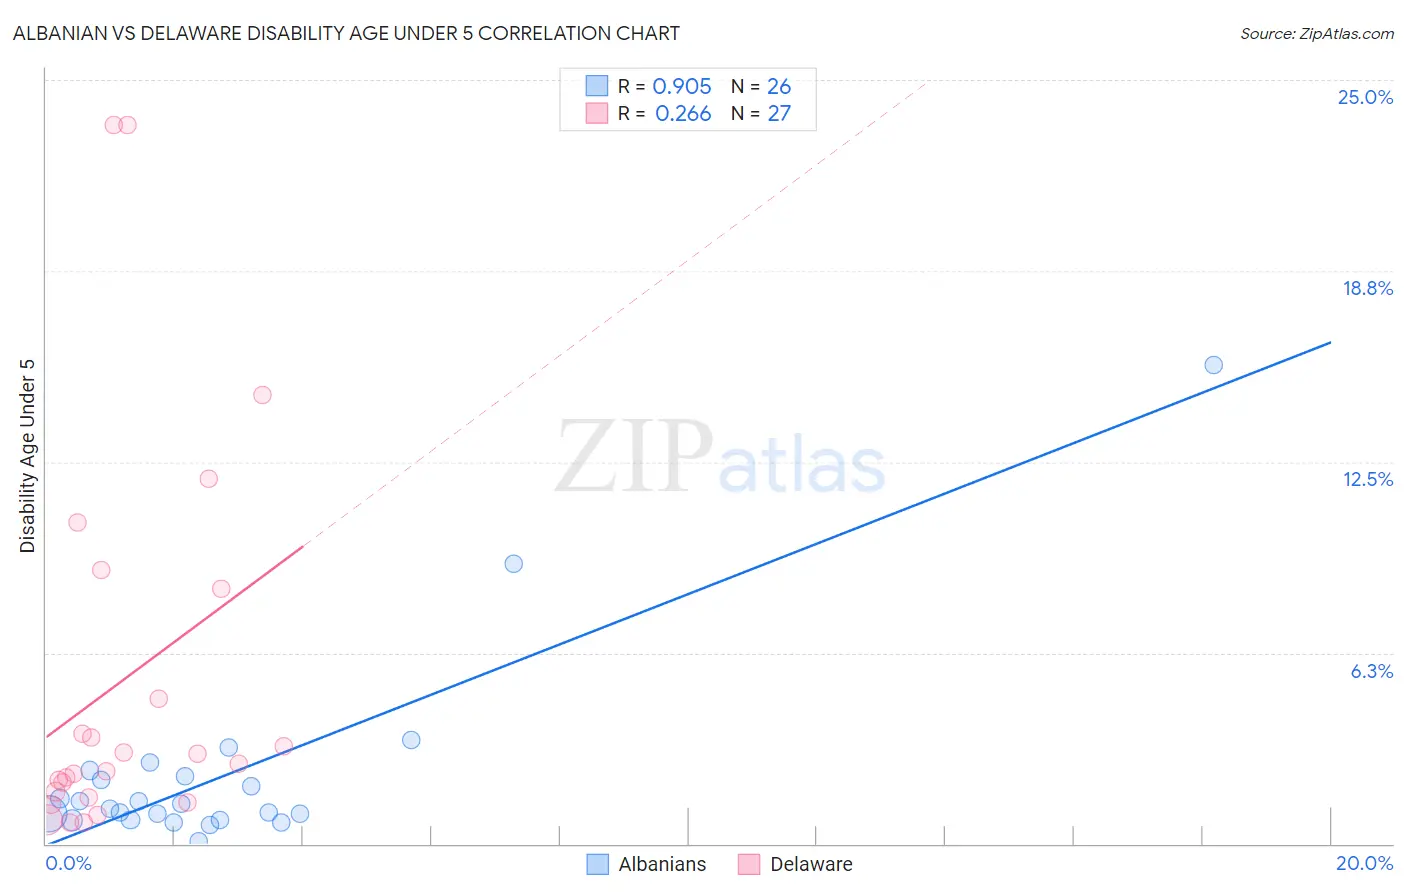
Albanian vs Delaware Disability Age Under 5 Correlation Chart
The statistical analysis conducted on geographies consisting of 123,207,813 people shows a near-perfect positive correlation between the proportion of Albanians and percentage of population with a disability under the age of 5 in the United States with a correlation coefficient (R) of 0.905 and weighted average of 1.1%. Similarly, the statistical analysis conducted on geographies consisting of 72,236,656 people shows a weak positive correlation between the proportion of Delaware and percentage of population with a disability under the age of 5 in the United States with a correlation coefficient (R) of 0.266 and weighted average of 1.5%, a difference of 33.2%.
Disability Age Under 5 Correlation Summary
| Measurement | Albanian | Delaware |
| Minimum | 0.063% | 0.70% |
| Maximum | 15.7% | 23.5% |
| Range | 15.6% | 22.8% |
| Mean | 2.3% | 5.4% |
| Median | 1.2% | 2.6% |
| Interquartile 25% (IQ1) | 0.78% | 1.5% |
| Interquartile 75% (IQ3) | 2.2% | 8.3% |
| Interquartile Range (IQR) | 1.4% | 6.8% |
| Standard Deviation (Sample) | 3.2% | 6.4% |
| Standard Deviation (Population) | 3.2% | 6.3% |
Similar Demographics by Disability Age Under 5
Demographics Similar to Albanians by Disability Age Under 5
In terms of disability age under 5, the demographic groups most similar to Albanians are Chinese (1.1%, a difference of 0.040%), Ethiopian (1.1%, a difference of 0.070%), Immigrants from Cuba (1.1%, a difference of 0.17%), Spanish American (1.1%, a difference of 0.20%), and Sri Lankan (1.1%, a difference of 0.26%).
| Demographics | Rating | Rank | Disability Age Under 5 |
| Immigrants | Zaire | 97.8 /100 | #84 | Exceptional 1.1% |
| Sudanese | 97.7 /100 | #85 | Exceptional 1.1% |
| Okinawans | 97.6 /100 | #86 | Exceptional 1.1% |
| Ugandans | 97.5 /100 | #87 | Exceptional 1.1% |
| Immigrants | Dominican Republic | 97.5 /100 | #88 | Exceptional 1.1% |
| Ethiopians | 97.2 /100 | #89 | Exceptional 1.1% |
| Chinese | 97.2 /100 | #90 | Exceptional 1.1% |
| Albanians | 97.2 /100 | #91 | Exceptional 1.1% |
| Immigrants | Cuba | 97.0 /100 | #92 | Exceptional 1.1% |
| Spanish Americans | 96.9 /100 | #93 | Exceptional 1.1% |
| Sri Lankans | 96.8 /100 | #94 | Exceptional 1.1% |
| Immigrants | Moldova | 96.8 /100 | #95 | Exceptional 1.1% |
| Mongolians | 96.6 /100 | #96 | Exceptional 1.1% |
| Immigrants | Iraq | 96.5 /100 | #97 | Exceptional 1.1% |
| Immigrants | South Eastern Asia | 96.5 /100 | #98 | Exceptional 1.1% |
Demographics Similar to Delaware by Disability Age Under 5
In terms of disability age under 5, the demographic groups most similar to Delaware are European (1.5%, a difference of 0.050%), Cheyenne (1.5%, a difference of 0.19%), Czechoslovakian (1.5%, a difference of 0.54%), Croatian (1.5%, a difference of 1.2%), and Tlingit-Haida (1.5%, a difference of 1.5%).
| Demographics | Rating | Rank | Disability Age Under 5 |
| Greeks | 0.0 /100 | #276 | Tragic 1.5% |
| Canadians | 0.0 /100 | #277 | Tragic 1.5% |
| Kiowa | 0.0 /100 | #278 | Tragic 1.5% |
| Danes | 0.0 /100 | #279 | Tragic 1.5% |
| British | 0.0 /100 | #280 | Tragic 1.5% |
| Czechoslovakians | 0.0 /100 | #281 | Tragic 1.5% |
| Cheyenne | 0.0 /100 | #282 | Tragic 1.5% |
| Delaware | 0.0 /100 | #283 | Tragic 1.5% |
| Europeans | 0.0 /100 | #284 | Tragic 1.5% |
| Croatians | 0.0 /100 | #285 | Tragic 1.5% |
| Tlingit-Haida | 0.0 /100 | #286 | Tragic 1.5% |
| Scandinavians | 0.0 /100 | #287 | Tragic 1.5% |
| Estonians | 0.0 /100 | #288 | Tragic 1.5% |
| Hungarians | 0.0 /100 | #289 | Tragic 1.5% |
| Czechs | 0.0 /100 | #290 | Tragic 1.5% |