Malaysian vs Immigrants from Jamaica 4th Grade
COMPARE
Malaysian
Immigrants from Jamaica
4th Grade
4th Grade Comparison
Malaysians
Immigrants from Jamaica
96.7%
4TH GRADE
0.0/ 100
METRIC RATING
292nd/ 347
METRIC RANK
97.0%
4TH GRADE
0.3/ 100
METRIC RATING
263rd/ 347
METRIC RANK
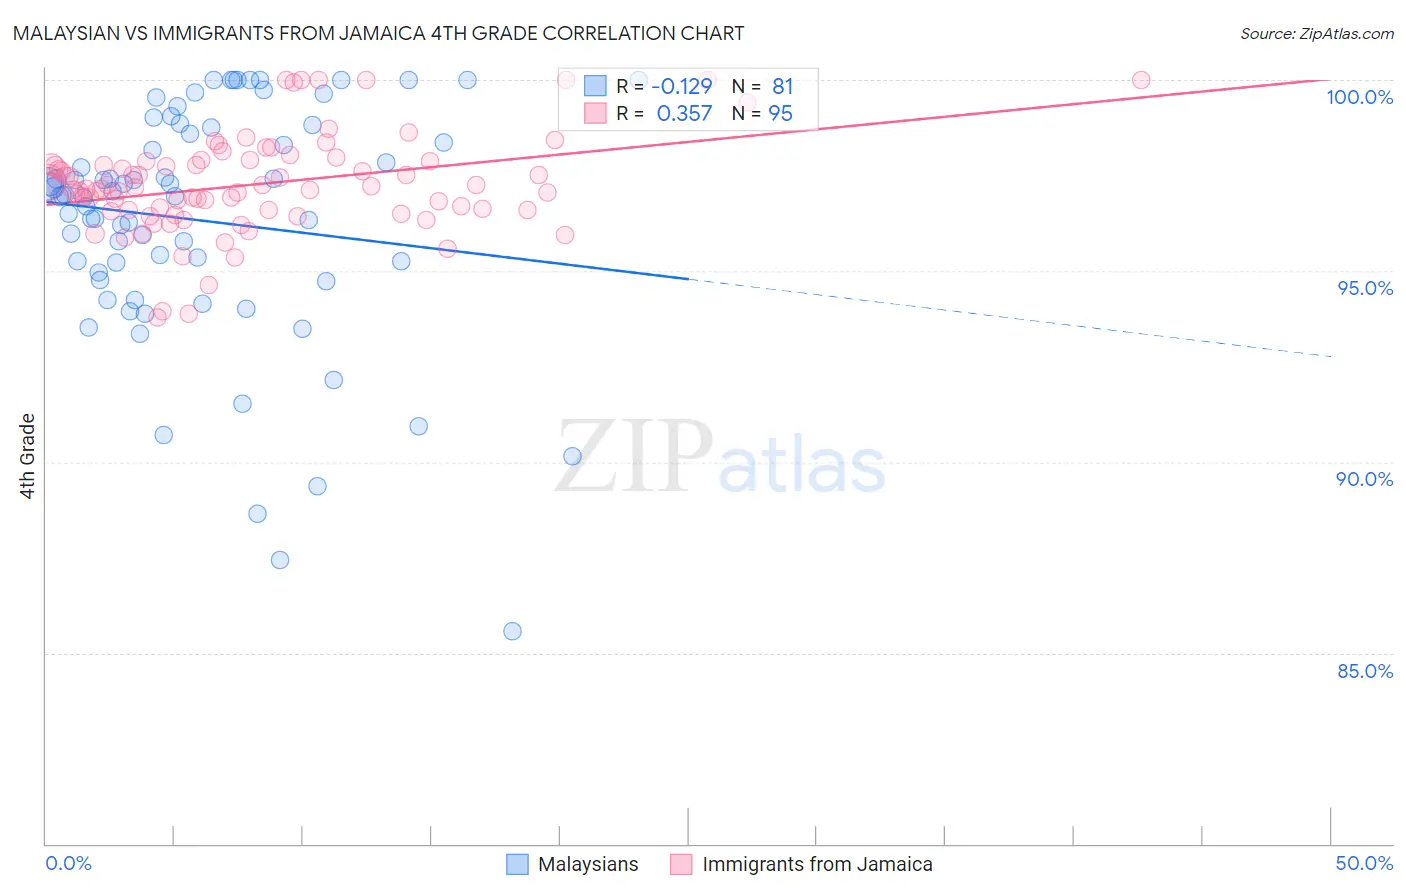
Malaysian vs Immigrants from Jamaica 4th Grade Correlation Chart
The statistical analysis conducted on geographies consisting of 226,107,000 people shows a poor negative correlation between the proportion of Malaysians and percentage of population with at least 4th grade education in the United States with a correlation coefficient (R) of -0.129 and weighted average of 96.7%. Similarly, the statistical analysis conducted on geographies consisting of 301,829,538 people shows a mild positive correlation between the proportion of Immigrants from Jamaica and percentage of population with at least 4th grade education in the United States with a correlation coefficient (R) of 0.357 and weighted average of 97.0%, a difference of 0.31%.
4th Grade Correlation Summary
| Measurement | Malaysian | Immigrants from Jamaica |
| Minimum | 85.6% | 93.8% |
| Maximum | 100.0% | 100.0% |
| Range | 14.4% | 6.2% |
| Mean | 96.3% | 97.3% |
| Median | 97.0% | 97.1% |
| Interquartile 25% (IQ1) | 94.9% | 96.6% |
| Interquartile 75% (IQ3) | 98.7% | 97.9% |
| Interquartile Range (IQR) | 3.8% | 1.3% |
| Standard Deviation (Sample) | 3.1% | 1.3% |
| Standard Deviation (Population) | 3.1% | 1.3% |
Similar Demographics by 4th Grade
Demographics Similar to Malaysians by 4th Grade
In terms of 4th grade, the demographic groups most similar to Malaysians are Immigrants from Grenada (96.7%, a difference of 0.010%), Puerto Rican (96.7%, a difference of 0.020%), British West Indian (96.7%, a difference of 0.040%), Immigrants from Eritrea (96.7%, a difference of 0.040%), and Immigrants from West Indies (96.7%, a difference of 0.050%).
| Demographics | Rating | Rank | 4th Grade |
| Immigrants | Barbados | 0.0 /100 | #285 | Tragic 96.8% |
| Immigrants | Thailand | 0.0 /100 | #286 | Tragic 96.8% |
| Houma | 0.0 /100 | #287 | Tragic 96.8% |
| Immigrants | Afghanistan | 0.0 /100 | #288 | Tragic 96.8% |
| Immigrants | West Indies | 0.0 /100 | #289 | Tragic 96.7% |
| British West Indians | 0.0 /100 | #290 | Tragic 96.7% |
| Immigrants | Grenada | 0.0 /100 | #291 | Tragic 96.7% |
| Malaysians | 0.0 /100 | #292 | Tragic 96.7% |
| Puerto Ricans | 0.0 /100 | #293 | Tragic 96.7% |
| Immigrants | Eritrea | 0.0 /100 | #294 | Tragic 96.7% |
| Immigrants | Portugal | 0.0 /100 | #295 | Tragic 96.6% |
| Somalis | 0.0 /100 | #296 | Tragic 96.6% |
| Immigrants | Somalia | 0.0 /100 | #297 | Tragic 96.5% |
| Haitians | 0.0 /100 | #298 | Tragic 96.5% |
| Immigrants | Dominica | 0.0 /100 | #299 | Tragic 96.5% |
Demographics Similar to Immigrants from Jamaica by 4th Grade
In terms of 4th grade, the demographic groups most similar to Immigrants from Jamaica are West Indian (97.0%, a difference of 0.0%), Immigrants from Sierra Leone (97.0%, a difference of 0.010%), Immigrants from South America (97.0%, a difference of 0.010%), Taiwanese (97.0%, a difference of 0.010%), and Immigrants from Ethiopia (97.0%, a difference of 0.020%).
| Demographics | Rating | Rank | 4th Grade |
| Bolivians | 0.7 /100 | #256 | Tragic 97.1% |
| Immigrants | Congo | 0.5 /100 | #257 | Tragic 97.0% |
| Immigrants | Colombia | 0.5 /100 | #258 | Tragic 97.0% |
| Immigrants | Ethiopia | 0.4 /100 | #259 | Tragic 97.0% |
| Immigrants | Sierra Leone | 0.4 /100 | #260 | Tragic 97.0% |
| Immigrants | South America | 0.4 /100 | #261 | Tragic 97.0% |
| West Indians | 0.4 /100 | #262 | Tragic 97.0% |
| Immigrants | Jamaica | 0.3 /100 | #263 | Tragic 97.0% |
| Taiwanese | 0.3 /100 | #264 | Tragic 97.0% |
| Armenians | 0.3 /100 | #265 | Tragic 97.0% |
| Immigrants | China | 0.3 /100 | #266 | Tragic 97.0% |
| Immigrants | Nigeria | 0.3 /100 | #267 | Tragic 97.0% |
| Ghanaians | 0.2 /100 | #268 | Tragic 97.0% |
| Immigrants | Uzbekistan | 0.2 /100 | #269 | Tragic 96.9% |
| Cubans | 0.2 /100 | #270 | Tragic 96.9% |