Chippewa vs Immigrants from Hungary Male Disability
COMPARE
Chippewa
Immigrants from Hungary
Male Disability
Male Disability Comparison
Chippewa
Immigrants from Hungary
14.3%
MALE DISABILITY
0.0/ 100
METRIC RATING
328th/ 347
METRIC RANK
11.1%
MALE DISABILITY
61.2/ 100
METRIC RATING
166th/ 347
METRIC RANK
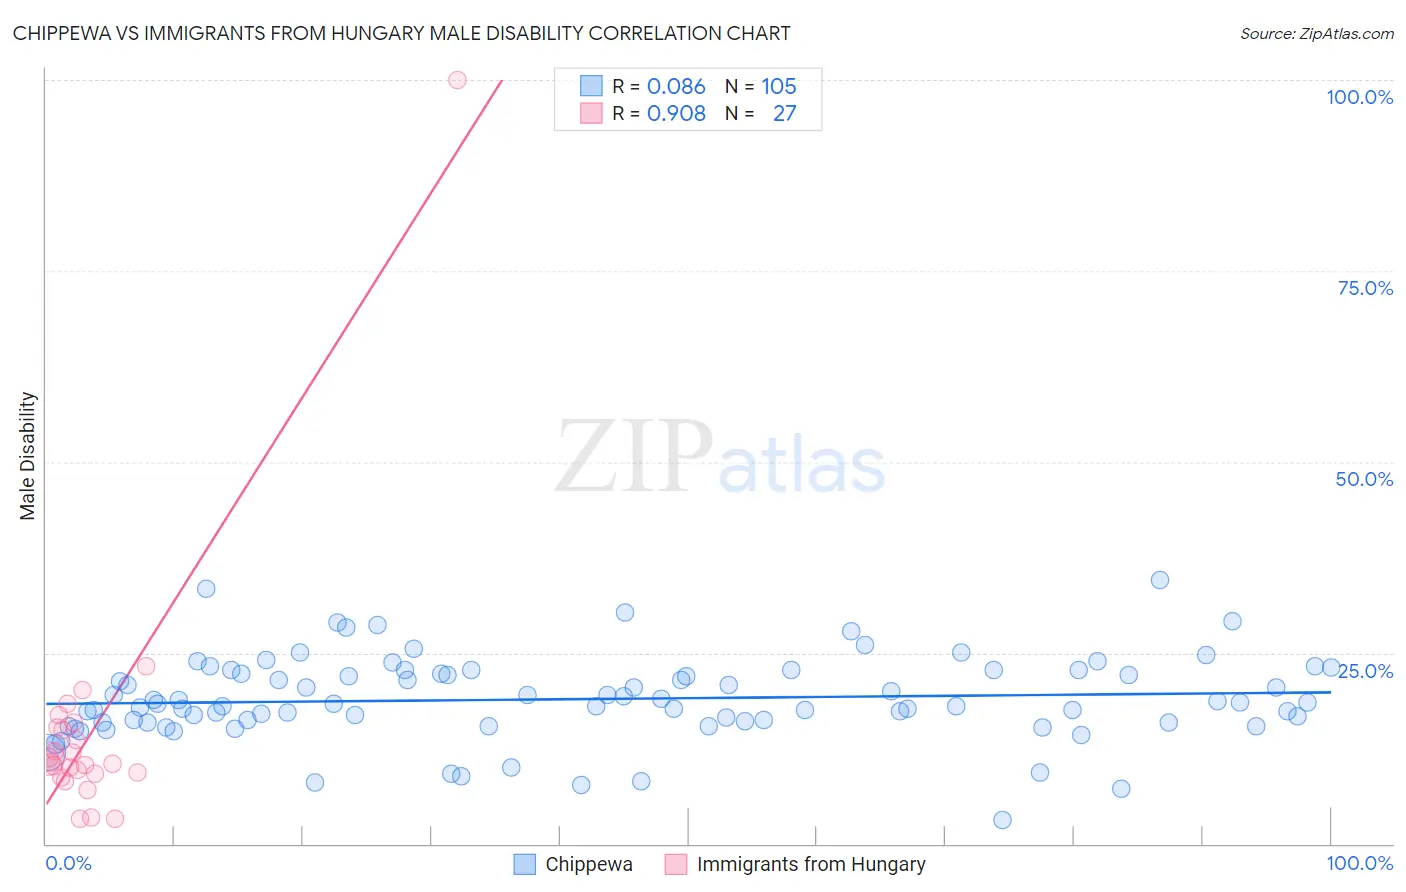
Chippewa vs Immigrants from Hungary Male Disability Correlation Chart
The statistical analysis conducted on geographies consisting of 215,038,110 people shows a slight positive correlation between the proportion of Chippewa and percentage of males with a disability in the United States with a correlation coefficient (R) of 0.086 and weighted average of 14.3%. Similarly, the statistical analysis conducted on geographies consisting of 195,705,126 people shows a near-perfect positive correlation between the proportion of Immigrants from Hungary and percentage of males with a disability in the United States with a correlation coefficient (R) of 0.908 and weighted average of 11.1%, a difference of 28.1%.
Male Disability Correlation Summary
| Measurement | Chippewa | Immigrants from Hungary |
| Minimum | 3.1% | 3.2% |
| Maximum | 34.5% | 100.0% |
| Range | 31.4% | 96.8% |
| Mean | 18.9% | 14.7% |
| Median | 18.3% | 10.7% |
| Interquartile 25% (IQ1) | 15.9% | 9.1% |
| Interquartile 75% (IQ3) | 22.5% | 15.3% |
| Interquartile Range (IQR) | 6.6% | 6.1% |
| Standard Deviation (Sample) | 5.5% | 17.7% |
| Standard Deviation (Population) | 5.4% | 17.4% |
Similar Demographics by Male Disability
Demographics Similar to Chippewa by Male Disability
In terms of male disability, the demographic groups most similar to Chippewa are Potawatomi (14.2%, a difference of 0.43%), Native/Alaskan (14.2%, a difference of 0.53%), Cajun (14.4%, a difference of 0.57%), Navajo (14.4%, a difference of 0.81%), and Ottawa (14.1%, a difference of 1.5%).
| Demographics | Rating | Rank | Male Disability |
| Shoshone | 0.0 /100 | #321 | Tragic 13.8% |
| Apache | 0.0 /100 | #322 | Tragic 14.0% |
| Osage | 0.0 /100 | #323 | Tragic 14.0% |
| Comanche | 0.0 /100 | #324 | Tragic 14.1% |
| Ottawa | 0.0 /100 | #325 | Tragic 14.1% |
| Natives/Alaskans | 0.0 /100 | #326 | Tragic 14.2% |
| Potawatomi | 0.0 /100 | #327 | Tragic 14.2% |
| Chippewa | 0.0 /100 | #328 | Tragic 14.3% |
| Cajuns | 0.0 /100 | #329 | Tragic 14.4% |
| Navajo | 0.0 /100 | #330 | Tragic 14.4% |
| Tohono O'odham | 0.0 /100 | #331 | Tragic 14.6% |
| Seminole | 0.0 /100 | #332 | Tragic 14.7% |
| Yuman | 0.0 /100 | #333 | Tragic 14.7% |
| Cherokee | 0.0 /100 | #334 | Tragic 14.8% |
| Dutch West Indians | 0.0 /100 | #335 | Tragic 14.8% |
Demographics Similar to Immigrants from Hungary by Male Disability
In terms of male disability, the demographic groups most similar to Immigrants from Hungary are Luxembourger (11.1%, a difference of 0.040%), British West Indian (11.1%, a difference of 0.090%), Immigrants from Kenya (11.1%, a difference of 0.15%), Immigrants from Haiti (11.1%, a difference of 0.25%), and Immigrants from West Indies (11.1%, a difference of 0.27%).
| Demographics | Rating | Rank | Male Disability |
| Guatemalans | 67.2 /100 | #159 | Good 11.1% |
| Albanians | 66.5 /100 | #160 | Good 11.1% |
| Immigrants | West Indies | 65.7 /100 | #161 | Good 11.1% |
| Immigrants | Haiti | 65.3 /100 | #162 | Good 11.1% |
| Immigrants | Kenya | 63.8 /100 | #163 | Good 11.1% |
| British West Indians | 62.8 /100 | #164 | Good 11.1% |
| Luxembourgers | 61.9 /100 | #165 | Good 11.1% |
| Immigrants | Hungary | 61.2 /100 | #166 | Good 11.1% |
| Immigrants | Southern Europe | 54.4 /100 | #167 | Average 11.2% |
| Immigrants | Latin America | 54.0 /100 | #168 | Average 11.2% |
| Barbadians | 53.4 /100 | #169 | Average 11.2% |
| New Zealanders | 52.9 /100 | #170 | Average 11.2% |
| Haitians | 52.5 /100 | #171 | Average 11.2% |
| Romanians | 50.7 /100 | #172 | Average 11.2% |
| Immigrants | Burma/Myanmar | 50.4 /100 | #173 | Average 11.2% |