Immigrants from Norway vs Lebanese Vision Disability
COMPARE
Immigrants from Norway
Lebanese
Vision Disability
Vision Disability Comparison
Immigrants from Norway
Lebanese
2.1%
VISION DISABILITY
75.5/ 100
METRIC RATING
151st/ 347
METRIC RANK
2.2%
VISION DISABILITY
54.3/ 100
METRIC RATING
171st/ 347
METRIC RANK
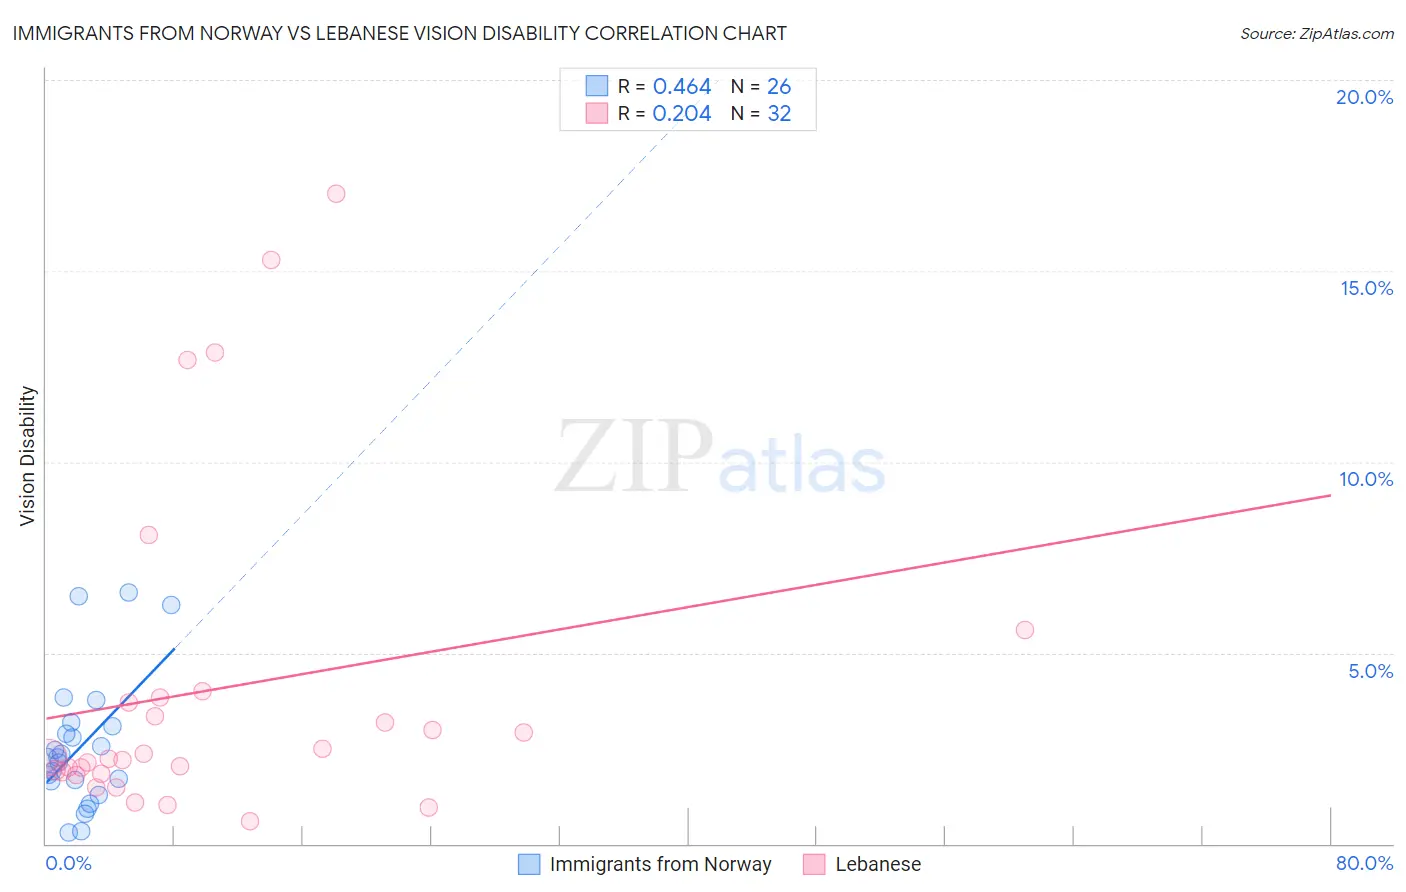
Immigrants from Norway vs Lebanese Vision Disability Correlation Chart
The statistical analysis conducted on geographies consisting of 116,669,624 people shows a moderate positive correlation between the proportion of Immigrants from Norway and percentage of population with vision disability in the United States with a correlation coefficient (R) of 0.464 and weighted average of 2.1%. Similarly, the statistical analysis conducted on geographies consisting of 401,298,237 people shows a weak positive correlation between the proportion of Lebanese and percentage of population with vision disability in the United States with a correlation coefficient (R) of 0.204 and weighted average of 2.2%, a difference of 1.5%.
Vision Disability Correlation Summary
| Measurement | Immigrants from Norway | Lebanese |
| Minimum | 0.30% | 0.58% |
| Maximum | 6.6% | 17.0% |
| Range | 6.3% | 16.4% |
| Mean | 2.5% | 4.0% |
| Median | 2.2% | 2.3% |
| Interquartile 25% (IQ1) | 1.6% | 1.9% |
| Interquartile 75% (IQ3) | 3.1% | 3.8% |
| Interquartile Range (IQR) | 1.4% | 1.9% |
| Standard Deviation (Sample) | 1.7% | 4.3% |
| Standard Deviation (Population) | 1.7% | 4.2% |
Demographics Similar to Immigrants from Norway and Lebanese by Vision Disability
In terms of vision disability, the demographic groups most similar to Immigrants from Norway are Immigrants from Southern Europe (2.1%, a difference of 0.080%), Immigrants from South America (2.1%, a difference of 0.15%), Slovene (2.1%, a difference of 0.16%), Immigrants from Colombia (2.1%, a difference of 0.28%), and Pakistani (2.1%, a difference of 0.32%). Similarly, the demographic groups most similar to Lebanese are Swiss (2.2%, a difference of 0.090%), South American Indian (2.2%, a difference of 0.20%), Brazilian (2.1%, a difference of 0.52%), Immigrants from Africa (2.1%, a difference of 0.55%), and Immigrants from England (2.1%, a difference of 0.56%).
| Demographics | Rating | Rank | Vision Disability |
| Immigrants | Norway | 75.5 /100 | #151 | Good 2.1% |
| Immigrants | Southern Europe | 74.6 /100 | #152 | Good 2.1% |
| Immigrants | South America | 73.8 /100 | #153 | Good 2.1% |
| Slovenes | 73.6 /100 | #154 | Good 2.1% |
| Immigrants | Colombia | 72.1 /100 | #155 | Good 2.1% |
| Pakistanis | 71.6 /100 | #156 | Good 2.1% |
| Serbians | 70.2 /100 | #157 | Good 2.1% |
| Immigrants | Uzbekistan | 69.9 /100 | #158 | Good 2.1% |
| South Africans | 69.8 /100 | #159 | Good 2.1% |
| Austrians | 69.0 /100 | #160 | Good 2.1% |
| Iraqis | 67.7 /100 | #161 | Good 2.1% |
| Hungarians | 67.4 /100 | #162 | Good 2.1% |
| Icelanders | 66.1 /100 | #163 | Good 2.1% |
| Immigrants | Bangladesh | 65.5 /100 | #164 | Good 2.1% |
| Immigrants | Iraq | 64.8 /100 | #165 | Good 2.1% |
| Immigrants | England | 62.8 /100 | #166 | Good 2.1% |
| Immigrants | Africa | 62.6 /100 | #167 | Good 2.1% |
| Brazilians | 62.2 /100 | #168 | Good 2.1% |
| South American Indians | 57.4 /100 | #169 | Average 2.2% |
| Swiss | 55.7 /100 | #170 | Average 2.2% |
| Lebanese | 54.3 /100 | #171 | Average 2.2% |