Immigrants from Europe vs Lebanese Vision Disability
COMPARE
Immigrants from Europe
Lebanese
Vision Disability
Vision Disability Comparison
Immigrants from Europe
Lebanese
2.1%
VISION DISABILITY
96.1/ 100
METRIC RATING
93rd/ 347
METRIC RANK
2.2%
VISION DISABILITY
54.3/ 100
METRIC RATING
171st/ 347
METRIC RANK
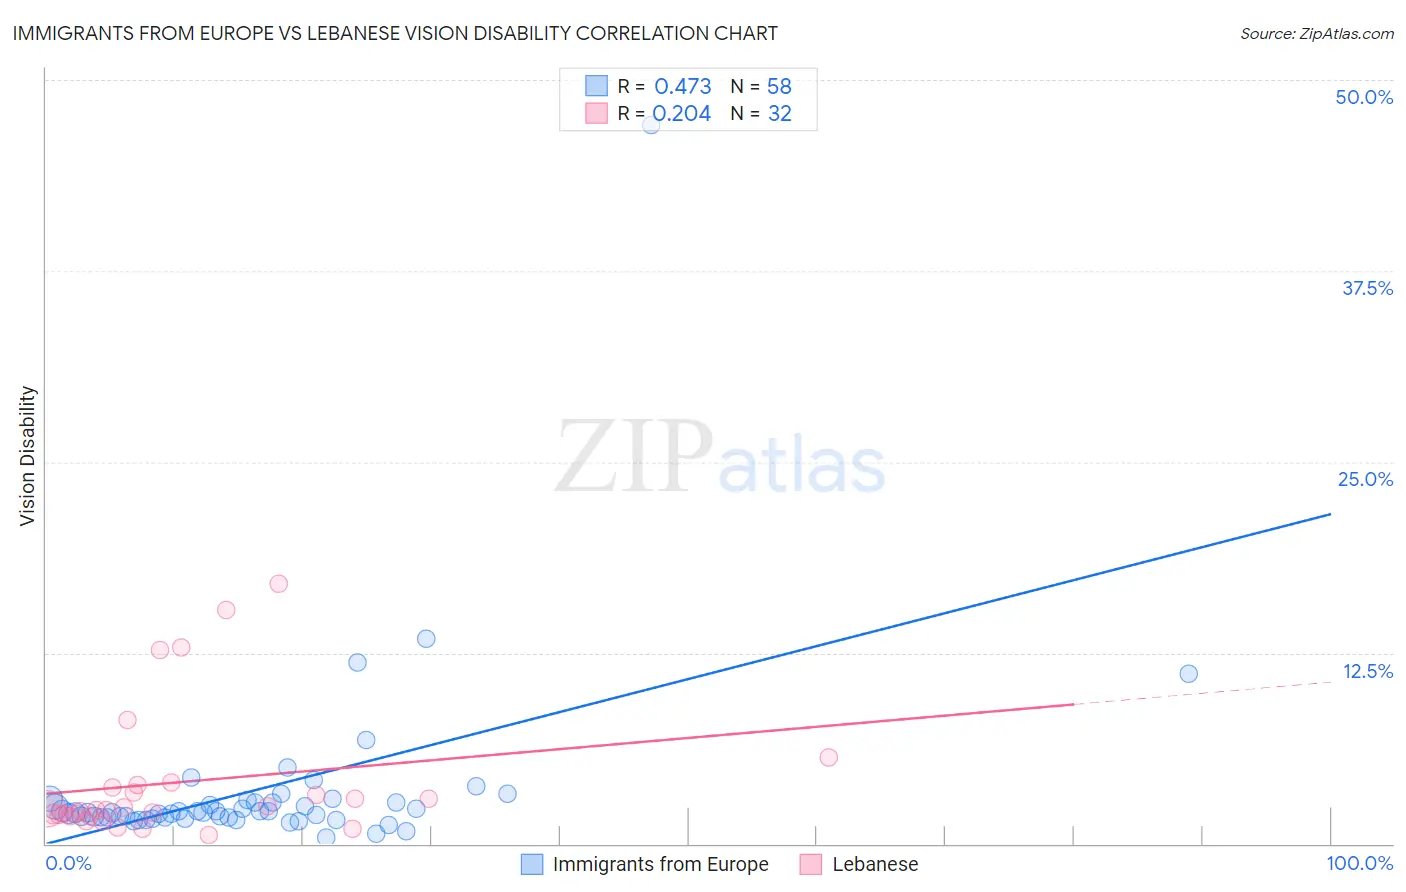
Immigrants from Europe vs Lebanese Vision Disability Correlation Chart
The statistical analysis conducted on geographies consisting of 546,008,895 people shows a moderate positive correlation between the proportion of Immigrants from Europe and percentage of population with vision disability in the United States with a correlation coefficient (R) of 0.473 and weighted average of 2.1%. Similarly, the statistical analysis conducted on geographies consisting of 401,298,237 people shows a weak positive correlation between the proportion of Lebanese and percentage of population with vision disability in the United States with a correlation coefficient (R) of 0.204 and weighted average of 2.2%, a difference of 5.0%.
Vision Disability Correlation Summary
| Measurement | Immigrants from Europe | Lebanese |
| Minimum | 0.41% | 0.58% |
| Maximum | 47.1% | 17.0% |
| Range | 46.7% | 16.4% |
| Mean | 3.5% | 4.0% |
| Median | 2.1% | 2.3% |
| Interquartile 25% (IQ1) | 1.7% | 1.9% |
| Interquartile 75% (IQ3) | 2.7% | 3.8% |
| Interquartile Range (IQR) | 1.0% | 1.9% |
| Standard Deviation (Sample) | 6.3% | 4.3% |
| Standard Deviation (Population) | 6.3% | 4.2% |
Similar Demographics by Vision Disability
Demographics Similar to Immigrants from Europe by Vision Disability
In terms of vision disability, the demographic groups most similar to Immigrants from Europe are Immigrants from Croatia (2.1%, a difference of 0.020%), Immigrants from Syria (2.1%, a difference of 0.050%), Immigrants from Somalia (2.1%, a difference of 0.060%), Australian (2.1%, a difference of 0.090%), and Romanian (2.1%, a difference of 0.15%).
| Demographics | Rating | Rank | Vision Disability |
| Immigrants | Moldova | 97.2 /100 | #86 | Exceptional 2.0% |
| Immigrants | Switzerland | 97.0 /100 | #87 | Exceptional 2.0% |
| Norwegians | 97.0 /100 | #88 | Exceptional 2.0% |
| Immigrants | Eastern Africa | 97.0 /100 | #89 | Exceptional 2.0% |
| Immigrants | Lebanon | 96.7 /100 | #90 | Exceptional 2.1% |
| Immigrants | Somalia | 96.2 /100 | #91 | Exceptional 2.1% |
| Immigrants | Syria | 96.2 /100 | #92 | Exceptional 2.1% |
| Immigrants | Europe | 96.1 /100 | #93 | Exceptional 2.1% |
| Immigrants | Croatia | 96.0 /100 | #94 | Exceptional 2.1% |
| Australians | 95.9 /100 | #95 | Exceptional 2.1% |
| Romanians | 95.7 /100 | #96 | Exceptional 2.1% |
| Immigrants | Afghanistan | 95.6 /100 | #97 | Exceptional 2.1% |
| Immigrants | South Africa | 95.4 /100 | #98 | Exceptional 2.1% |
| Estonians | 95.3 /100 | #99 | Exceptional 2.1% |
| Greeks | 95.1 /100 | #100 | Exceptional 2.1% |
Demographics Similar to Lebanese by Vision Disability
In terms of vision disability, the demographic groups most similar to Lebanese are Swiss (2.2%, a difference of 0.090%), South American Indian (2.2%, a difference of 0.20%), Northern European (2.2%, a difference of 0.26%), Scandinavian (2.2%, a difference of 0.27%), and Immigrants from Canada (2.2%, a difference of 0.27%).
| Demographics | Rating | Rank | Vision Disability |
| Immigrants | Bangladesh | 65.5 /100 | #164 | Good 2.1% |
| Immigrants | Iraq | 64.8 /100 | #165 | Good 2.1% |
| Immigrants | England | 62.8 /100 | #166 | Good 2.1% |
| Immigrants | Africa | 62.6 /100 | #167 | Good 2.1% |
| Brazilians | 62.2 /100 | #168 | Good 2.1% |
| South American Indians | 57.4 /100 | #169 | Average 2.2% |
| Swiss | 55.7 /100 | #170 | Average 2.2% |
| Lebanese | 54.3 /100 | #171 | Average 2.2% |
| Northern Europeans | 50.1 /100 | #172 | Average 2.2% |
| Scandinavians | 50.0 /100 | #173 | Average 2.2% |
| Immigrants | Canada | 50.0 /100 | #174 | Average 2.2% |
| Immigrants | Fiji | 47.6 /100 | #175 | Average 2.2% |
| Yugoslavians | 46.5 /100 | #176 | Average 2.2% |
| Slavs | 46.0 /100 | #177 | Average 2.2% |
| Immigrants | Oceania | 45.1 /100 | #178 | Average 2.2% |