Luxembourger vs Jamaican 9th Grade
COMPARE
Luxembourger
Jamaican
9th Grade
9th Grade Comparison
Luxembourgers
Jamaicans
96.3%
9TH GRADE
100.0/ 100
METRIC RATING
33rd/ 347
METRIC RANK
94.1%
9TH GRADE
1.0/ 100
METRIC RATING
251st/ 347
METRIC RANK
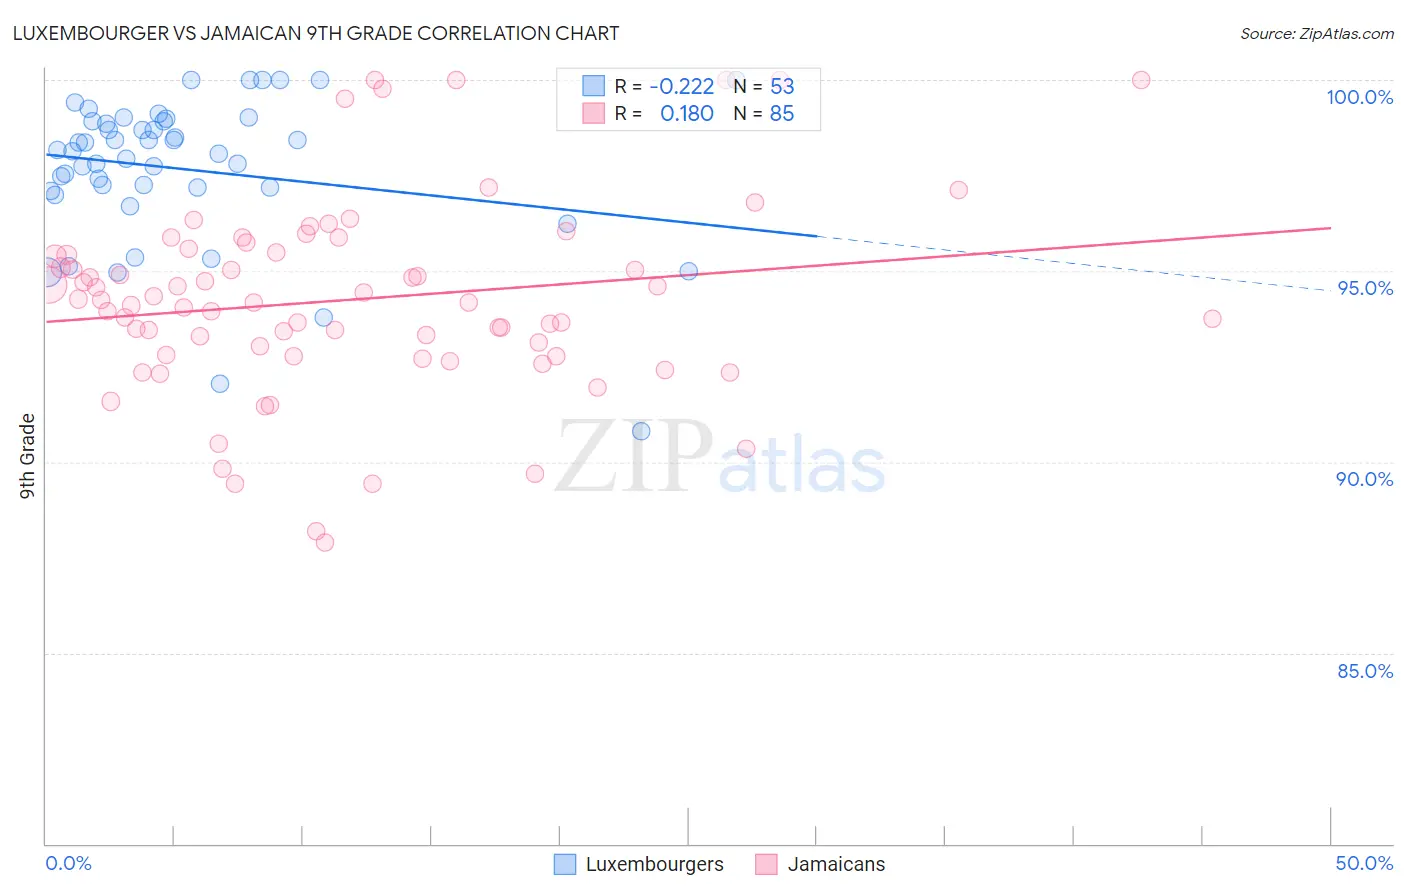
Luxembourger vs Jamaican 9th Grade Correlation Chart
The statistical analysis conducted on geographies consisting of 144,676,190 people shows a weak negative correlation between the proportion of Luxembourgers and percentage of population with at least 9th grade education in the United States with a correlation coefficient (R) of -0.222 and weighted average of 96.3%. Similarly, the statistical analysis conducted on geographies consisting of 368,084,732 people shows a poor positive correlation between the proportion of Jamaicans and percentage of population with at least 9th grade education in the United States with a correlation coefficient (R) of 0.180 and weighted average of 94.1%, a difference of 2.3%.
9th Grade Correlation Summary
| Measurement | Luxembourger | Jamaican |
| Minimum | 90.8% | 87.9% |
| Maximum | 100.0% | 100.0% |
| Range | 9.2% | 12.1% |
| Mean | 97.7% | 94.2% |
| Median | 98.1% | 94.2% |
| Interquartile 25% (IQ1) | 97.1% | 92.8% |
| Interquartile 75% (IQ3) | 98.9% | 95.5% |
| Interquartile Range (IQR) | 1.8% | 2.8% |
| Standard Deviation (Sample) | 1.9% | 2.6% |
| Standard Deviation (Population) | 1.9% | 2.5% |
Similar Demographics by 9th Grade
Demographics Similar to Luxembourgers by 9th Grade
In terms of 9th grade, the demographic groups most similar to Luxembourgers are British (96.3%, a difference of 0.010%), Belgian (96.3%, a difference of 0.010%), Maltese (96.3%, a difference of 0.020%), Hungarian (96.2%, a difference of 0.030%), and Chinese (96.3%, a difference of 0.040%).
| Demographics | Rating | Rank | 9th Grade |
| French Canadians | 100.0 /100 | #26 | Exceptional 96.3% |
| Scotch-Irish | 100.0 /100 | #27 | Exceptional 96.3% |
| Eastern Europeans | 100.0 /100 | #28 | Exceptional 96.3% |
| Chinese | 100.0 /100 | #29 | Exceptional 96.3% |
| Maltese | 100.0 /100 | #30 | Exceptional 96.3% |
| British | 100.0 /100 | #31 | Exceptional 96.3% |
| Belgians | 100.0 /100 | #32 | Exceptional 96.3% |
| Luxembourgers | 100.0 /100 | #33 | Exceptional 96.3% |
| Hungarians | 100.0 /100 | #34 | Exceptional 96.2% |
| Bulgarians | 99.9 /100 | #35 | Exceptional 96.2% |
| Northern Europeans | 99.9 /100 | #36 | Exceptional 96.2% |
| Estonians | 99.9 /100 | #37 | Exceptional 96.1% |
| Immigrants | Scotland | 99.9 /100 | #38 | Exceptional 96.1% |
| Ottawa | 99.9 /100 | #39 | Exceptional 96.1% |
| Slavs | 99.9 /100 | #40 | Exceptional 96.1% |
Demographics Similar to Jamaicans by 9th Grade
In terms of 9th grade, the demographic groups most similar to Jamaicans are Immigrants from Senegal (94.1%, a difference of 0.010%), Colombian (94.0%, a difference of 0.030%), Uruguayan (94.1%, a difference of 0.060%), Immigrants from Hong Kong (94.1%, a difference of 0.060%), and U.S. Virgin Islander (94.0%, a difference of 0.060%).
| Demographics | Rating | Rank | 9th Grade |
| Dutch West Indians | 2.0 /100 | #244 | Tragic 94.2% |
| Paiute | 1.9 /100 | #245 | Tragic 94.2% |
| Senegalese | 1.9 /100 | #246 | Tragic 94.2% |
| Afghans | 1.8 /100 | #247 | Tragic 94.2% |
| Immigrants | Somalia | 1.4 /100 | #248 | Tragic 94.1% |
| Uruguayans | 1.3 /100 | #249 | Tragic 94.1% |
| Immigrants | Hong Kong | 1.3 /100 | #250 | Tragic 94.1% |
| Jamaicans | 1.0 /100 | #251 | Tragic 94.1% |
| Immigrants | Senegal | 0.9 /100 | #252 | Tragic 94.1% |
| Colombians | 0.8 /100 | #253 | Tragic 94.0% |
| U.S. Virgin Islanders | 0.7 /100 | #254 | Tragic 94.0% |
| Immigrants | Nigeria | 0.6 /100 | #255 | Tragic 94.0% |
| Immigrants | Afghanistan | 0.5 /100 | #256 | Tragic 94.0% |
| Immigrants | Costa Rica | 0.5 /100 | #257 | Tragic 94.0% |
| Immigrants | Thailand | 0.5 /100 | #258 | Tragic 93.9% |