Spanish American vs Immigrants from India Vision Disability
COMPARE
Spanish American
Immigrants from India
Vision Disability
Vision Disability Comparison
Spanish Americans
Immigrants from India
2.9%
VISION DISABILITY
0.0/ 100
METRIC RATING
326th/ 347
METRIC RANK
1.7%
VISION DISABILITY
100.0/ 100
METRIC RATING
1st/ 347
METRIC RANK
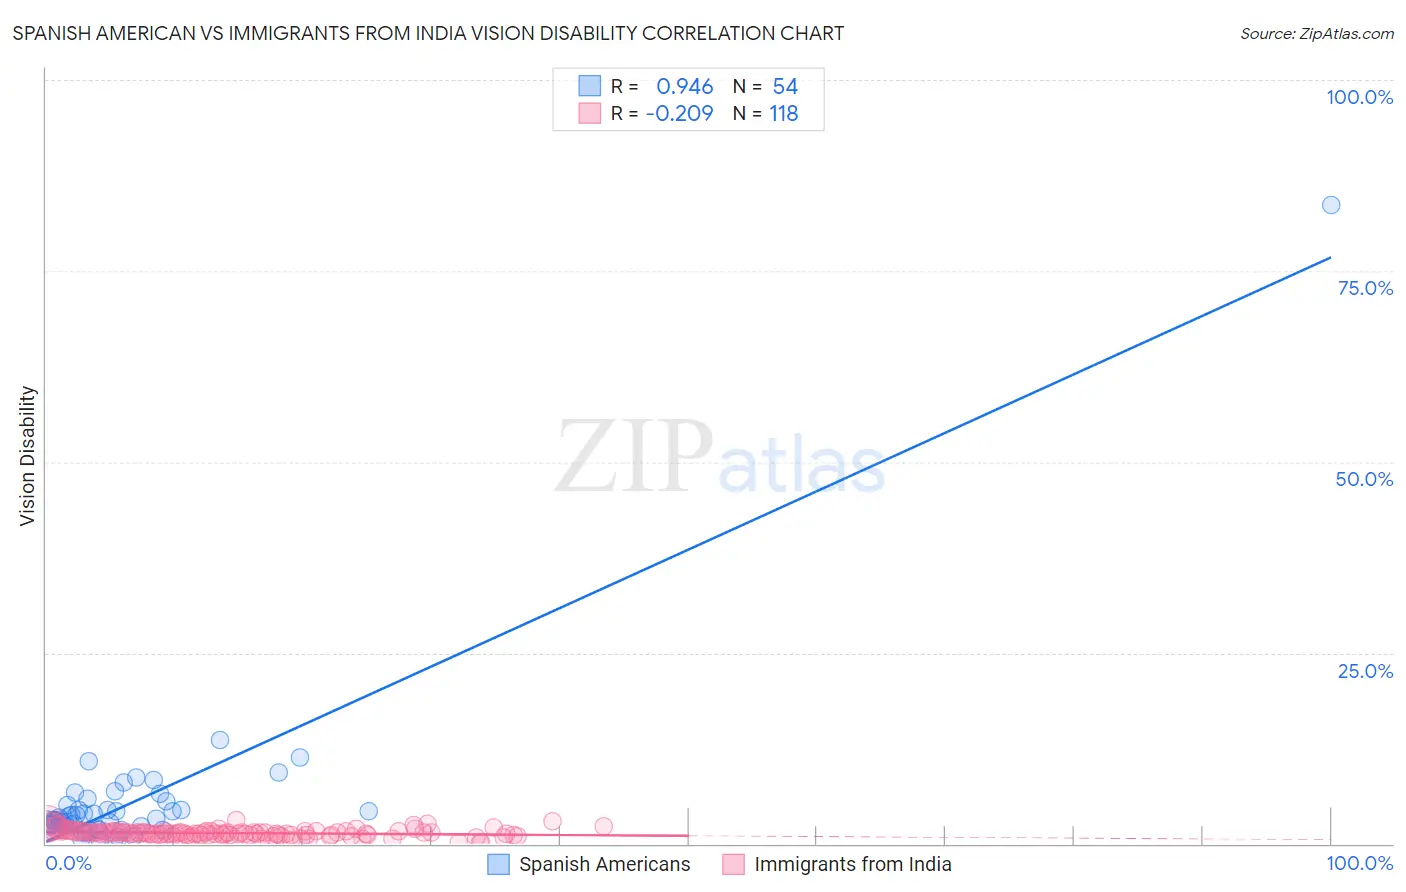
Spanish American vs Immigrants from India Vision Disability Correlation Chart
The statistical analysis conducted on geographies consisting of 103,153,251 people shows a near-perfect positive correlation between the proportion of Spanish Americans and percentage of population with vision disability in the United States with a correlation coefficient (R) of 0.946 and weighted average of 2.9%. Similarly, the statistical analysis conducted on geographies consisting of 433,750,609 people shows a weak negative correlation between the proportion of Immigrants from India and percentage of population with vision disability in the United States with a correlation coefficient (R) of -0.209 and weighted average of 1.7%, a difference of 74.9%.
Vision Disability Correlation Summary
| Measurement | Spanish American | Immigrants from India |
| Minimum | 0.38% | 0.17% |
| Maximum | 83.6% | 3.1% |
| Range | 83.3% | 2.9% |
| Mean | 5.5% | 1.4% |
| Median | 3.3% | 1.4% |
| Interquartile 25% (IQ1) | 2.3% | 1.2% |
| Interquartile 75% (IQ3) | 5.0% | 1.6% |
| Interquartile Range (IQR) | 2.7% | 0.43% |
| Standard Deviation (Sample) | 11.2% | 0.49% |
| Standard Deviation (Population) | 11.1% | 0.49% |
Similar Demographics by Vision Disability
Demographics Similar to Spanish Americans by Vision Disability
In terms of vision disability, the demographic groups most similar to Spanish Americans are Native/Alaskan (3.0%, a difference of 0.80%), Cherokee (2.9%, a difference of 1.2%), Hopi (2.9%, a difference of 1.2%), Yuman (3.0%, a difference of 1.3%), and Apache (3.0%, a difference of 1.5%).
| Demographics | Rating | Rank | Vision Disability |
| Tohono O'odham | 0.0 /100 | #319 | Tragic 2.8% |
| Blacks/African Americans | 0.0 /100 | #320 | Tragic 2.8% |
| Comanche | 0.0 /100 | #321 | Tragic 2.8% |
| Paiute | 0.0 /100 | #322 | Tragic 2.9% |
| Tlingit-Haida | 0.0 /100 | #323 | Tragic 2.9% |
| Hopi | 0.0 /100 | #324 | Tragic 2.9% |
| Cherokee | 0.0 /100 | #325 | Tragic 2.9% |
| Spanish Americans | 0.0 /100 | #326 | Tragic 2.9% |
| Natives/Alaskans | 0.0 /100 | #327 | Tragic 3.0% |
| Yuman | 0.0 /100 | #328 | Tragic 3.0% |
| Apache | 0.0 /100 | #329 | Tragic 3.0% |
| Colville | 0.0 /100 | #330 | Tragic 3.0% |
| Central American Indians | 0.0 /100 | #331 | Tragic 3.0% |
| Seminole | 0.0 /100 | #332 | Tragic 3.1% |
| Cajuns | 0.0 /100 | #333 | Tragic 3.1% |
Demographics Similar to Immigrants from India by Vision Disability
In terms of vision disability, the demographic groups most similar to Immigrants from India are Filipino (1.7%, a difference of 0.050%), Immigrants from Taiwan (1.7%, a difference of 0.71%), Thai (1.7%, a difference of 3.4%), Okinawan (1.8%, a difference of 5.3%), and Immigrants from Iran (1.8%, a difference of 6.0%).
| Demographics | Rating | Rank | Vision Disability |
| Immigrants | India | 100.0 /100 | #1 | Exceptional 1.7% |
| Filipinos | 100.0 /100 | #2 | Exceptional 1.7% |
| Immigrants | Taiwan | 100.0 /100 | #3 | Exceptional 1.7% |
| Thais | 100.0 /100 | #4 | Exceptional 1.7% |
| Okinawans | 100.0 /100 | #5 | Exceptional 1.8% |
| Immigrants | Iran | 100.0 /100 | #6 | Exceptional 1.8% |
| Immigrants | South Central Asia | 100.0 /100 | #7 | Exceptional 1.8% |
| Iranians | 100.0 /100 | #8 | Exceptional 1.8% |
| Immigrants | Singapore | 100.0 /100 | #9 | Exceptional 1.8% |
| Immigrants | Hong Kong | 100.0 /100 | #10 | Exceptional 1.8% |
| Immigrants | Israel | 100.0 /100 | #11 | Exceptional 1.8% |
| Immigrants | Korea | 100.0 /100 | #12 | Exceptional 1.8% |
| Immigrants | Eastern Asia | 100.0 /100 | #13 | Exceptional 1.8% |
| Immigrants | China | 100.0 /100 | #14 | Exceptional 1.8% |
| Immigrants | Bolivia | 100.0 /100 | #15 | Exceptional 1.8% |