Luxembourger vs Immigrants from India Ambulatory Disability
COMPARE
Luxembourger
Immigrants from India
Ambulatory Disability
Ambulatory Disability Comparison
Luxembourgers
Immigrants from India
5.6%
AMBULATORY DISABILITY
99.9/ 100
METRIC RATING
50th/ 347
METRIC RANK
4.8%
AMBULATORY DISABILITY
100.0/ 100
METRIC RATING
1st/ 347
METRIC RANK
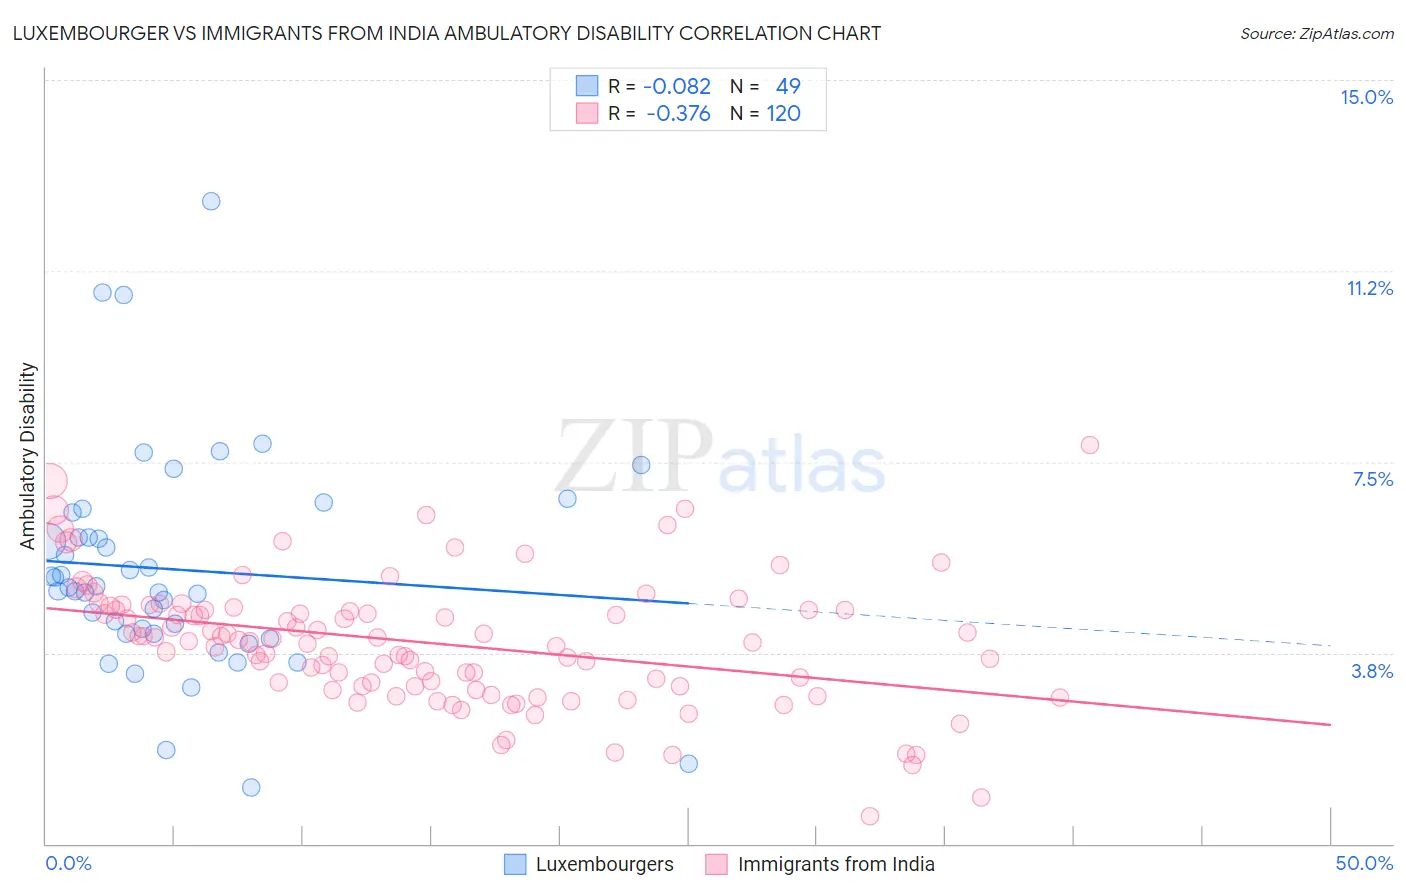
Luxembourger vs Immigrants from India Ambulatory Disability Correlation Chart
The statistical analysis conducted on geographies consisting of 144,679,340 people shows a slight negative correlation between the proportion of Luxembourgers and percentage of population with ambulatory disability in the United States with a correlation coefficient (R) of -0.082 and weighted average of 5.6%. Similarly, the statistical analysis conducted on geographies consisting of 433,949,483 people shows a mild negative correlation between the proportion of Immigrants from India and percentage of population with ambulatory disability in the United States with a correlation coefficient (R) of -0.376 and weighted average of 4.8%, a difference of 17.2%.
Ambulatory Disability Correlation Summary
| Measurement | Luxembourger | Immigrants from India |
| Minimum | 1.1% | 0.54% |
| Maximum | 12.6% | 7.8% |
| Range | 11.5% | 7.3% |
| Mean | 5.4% | 4.0% |
| Median | 5.0% | 4.0% |
| Interquartile 25% (IQ1) | 4.1% | 3.1% |
| Interquartile 75% (IQ3) | 6.3% | 4.6% |
| Interquartile Range (IQR) | 2.1% | 1.5% |
| Standard Deviation (Sample) | 2.2% | 1.3% |
| Standard Deviation (Population) | 2.1% | 1.2% |
Similar Demographics by Ambulatory Disability
Demographics Similar to Luxembourgers by Ambulatory Disability
In terms of ambulatory disability, the demographic groups most similar to Luxembourgers are Taiwanese (5.6%, a difference of 0.10%), Jordanian (5.6%, a difference of 0.19%), Immigrants from Egypt (5.6%, a difference of 0.20%), Immigrants from Eastern Africa (5.6%, a difference of 0.25%), and Immigrants from Bulgaria (5.6%, a difference of 0.31%).
| Demographics | Rating | Rank | Ambulatory Disability |
| Paraguayans | 99.9 /100 | #43 | Exceptional 5.5% |
| Immigrants | Indonesia | 99.9 /100 | #44 | Exceptional 5.5% |
| Immigrants | Sweden | 99.9 /100 | #45 | Exceptional 5.6% |
| Egyptians | 99.9 /100 | #46 | Exceptional 5.6% |
| Immigrants | Japan | 99.9 /100 | #47 | Exceptional 5.6% |
| Immigrants | Argentina | 99.9 /100 | #48 | Exceptional 5.6% |
| Bulgarians | 99.9 /100 | #49 | Exceptional 5.6% |
| Luxembourgers | 99.9 /100 | #50 | Exceptional 5.6% |
| Taiwanese | 99.8 /100 | #51 | Exceptional 5.6% |
| Jordanians | 99.8 /100 | #52 | Exceptional 5.6% |
| Immigrants | Egypt | 99.8 /100 | #53 | Exceptional 5.6% |
| Immigrants | Eastern Africa | 99.8 /100 | #54 | Exceptional 5.6% |
| Immigrants | Bulgaria | 99.8 /100 | #55 | Exceptional 5.6% |
| Inupiat | 99.8 /100 | #56 | Exceptional 5.6% |
| Immigrants | Brazil | 99.8 /100 | #57 | Exceptional 5.6% |
Demographics Similar to Immigrants from India by Ambulatory Disability
In terms of ambulatory disability, the demographic groups most similar to Immigrants from India are Filipino (4.9%, a difference of 2.0%), Thai (4.9%, a difference of 3.2%), Immigrants from Taiwan (4.9%, a difference of 3.5%), Immigrants from Singapore (5.0%, a difference of 4.9%), and Immigrants from Bolivia (5.0%, a difference of 5.7%).
| Demographics | Rating | Rank | Ambulatory Disability |
| Immigrants | India | 100.0 /100 | #1 | Exceptional 4.8% |
| Filipinos | 100.0 /100 | #2 | Exceptional 4.9% |
| Thais | 100.0 /100 | #3 | Exceptional 4.9% |
| Immigrants | Taiwan | 100.0 /100 | #4 | Exceptional 4.9% |
| Immigrants | Singapore | 100.0 /100 | #5 | Exceptional 5.0% |
| Immigrants | Bolivia | 100.0 /100 | #6 | Exceptional 5.0% |
| Bolivians | 100.0 /100 | #7 | Exceptional 5.1% |
| Immigrants | South Central Asia | 100.0 /100 | #8 | Exceptional 5.1% |
| Iranians | 100.0 /100 | #9 | Exceptional 5.1% |
| Yup'ik | 100.0 /100 | #10 | Exceptional 5.2% |
| Immigrants | Korea | 100.0 /100 | #11 | Exceptional 5.2% |
| Okinawans | 100.0 /100 | #12 | Exceptional 5.3% |
| Burmese | 100.0 /100 | #13 | Exceptional 5.3% |
| Immigrants | Eastern Asia | 100.0 /100 | #14 | Exceptional 5.3% |
| Immigrants | China | 100.0 /100 | #15 | Exceptional 5.3% |