Nicaraguan vs Uruguayan Disability Age 5 to 17
COMPARE
Nicaraguan
Uruguayan
Disability Age 5 to 17
Disability Age 5 to 17 Comparison
Nicaraguans
Uruguayans
5.3%
DISABILITY AGE 5 TO 17
98.6/ 100
METRIC RATING
102nd/ 347
METRIC RANK
5.6%
DISABILITY AGE 5 TO 17
51.0/ 100
METRIC RATING
173rd/ 347
METRIC RANK
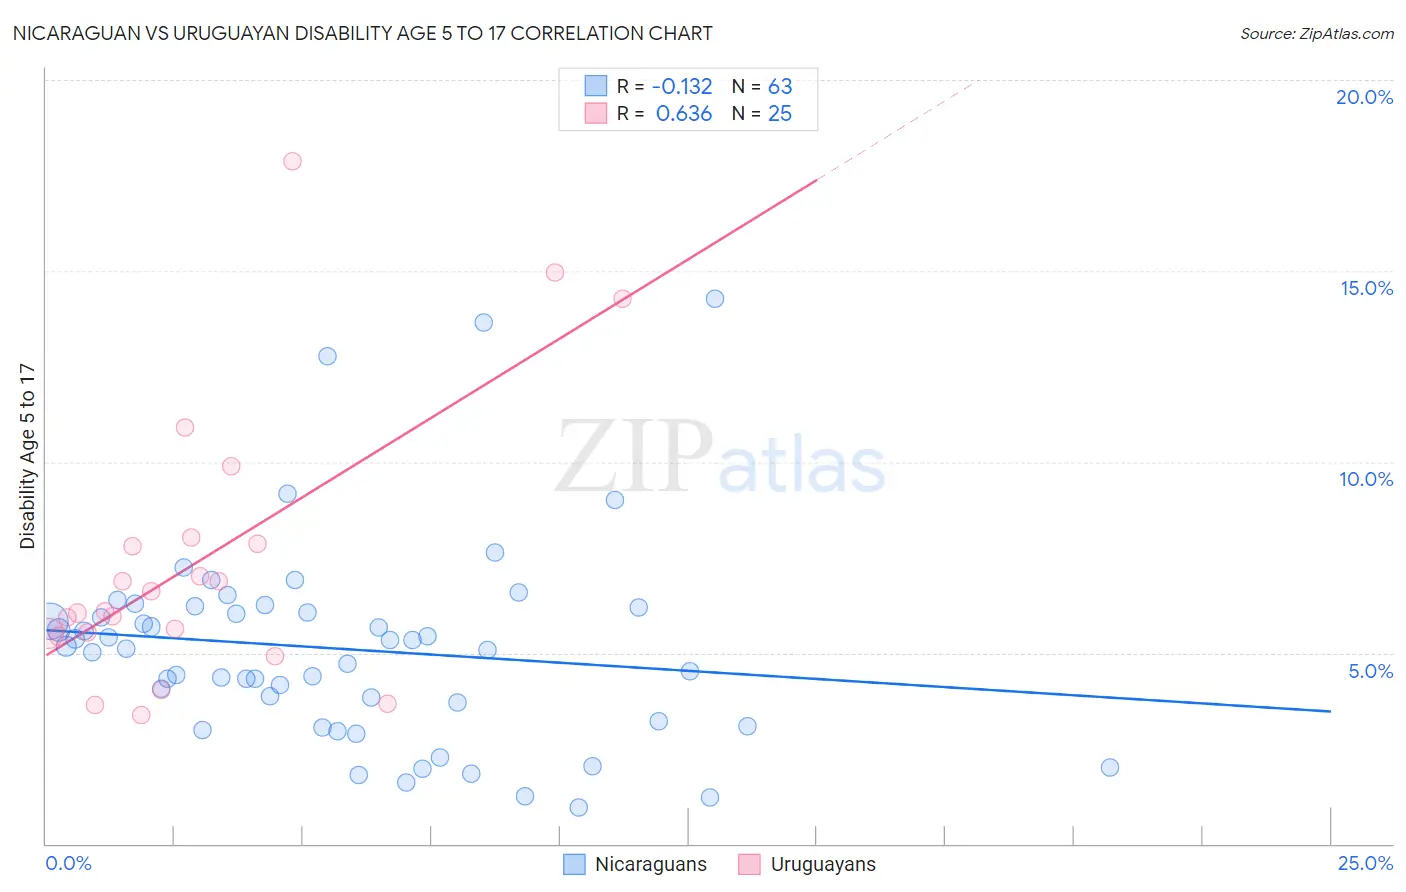
Nicaraguan vs Uruguayan Disability Age 5 to 17 Correlation Chart
The statistical analysis conducted on geographies consisting of 284,558,915 people shows a poor negative correlation between the proportion of Nicaraguans and percentage of population with a disability between the ages 5 and 17 in the United States with a correlation coefficient (R) of -0.132 and weighted average of 5.3%. Similarly, the statistical analysis conducted on geographies consisting of 144,432,233 people shows a significant positive correlation between the proportion of Uruguayans and percentage of population with a disability between the ages 5 and 17 in the United States with a correlation coefficient (R) of 0.636 and weighted average of 5.6%, a difference of 5.5%.
Disability Age 5 to 17 Correlation Summary
| Measurement | Nicaraguan | Uruguayan |
| Minimum | 0.96% | 3.4% |
| Maximum | 14.3% | 17.9% |
| Range | 13.3% | 14.5% |
| Mean | 5.1% | 7.4% |
| Median | 5.1% | 6.1% |
| Interquartile 25% (IQ1) | 3.2% | 5.5% |
| Interquartile 75% (IQ3) | 6.2% | 7.9% |
| Interquartile Range (IQR) | 3.0% | 2.5% |
| Standard Deviation (Sample) | 2.7% | 3.6% |
| Standard Deviation (Population) | 2.6% | 3.6% |
Similar Demographics by Disability Age 5 to 17
Demographics Similar to Nicaraguans by Disability Age 5 to 17
In terms of disability age 5 to 17, the demographic groups most similar to Nicaraguans are Salvadoran (5.3%, a difference of 0.030%), Menominee (5.3%, a difference of 0.080%), Nepalese (5.3%, a difference of 0.10%), Peruvian (5.3%, a difference of 0.10%), and Immigrants from Italy (5.3%, a difference of 0.19%).
| Demographics | Rating | Rank | Disability Age 5 to 17 |
| Immigrants | Grenada | 99.1 /100 | #95 | Exceptional 5.3% |
| Immigrants | El Salvador | 99.0 /100 | #96 | Exceptional 5.3% |
| Immigrants | Europe | 99.0 /100 | #97 | Exceptional 5.3% |
| Immigrants | Austria | 98.9 /100 | #98 | Exceptional 5.3% |
| Cambodians | 98.8 /100 | #99 | Exceptional 5.3% |
| Nepalese | 98.7 /100 | #100 | Exceptional 5.3% |
| Menominee | 98.7 /100 | #101 | Exceptional 5.3% |
| Nicaraguans | 98.6 /100 | #102 | Exceptional 5.3% |
| Salvadorans | 98.6 /100 | #103 | Exceptional 5.3% |
| Peruvians | 98.5 /100 | #104 | Exceptional 5.3% |
| Immigrants | Italy | 98.4 /100 | #105 | Exceptional 5.3% |
| Immigrants | Yemen | 98.2 /100 | #106 | Exceptional 5.3% |
| Russians | 98.2 /100 | #107 | Exceptional 5.3% |
| Immigrants | South Africa | 98.1 /100 | #108 | Exceptional 5.3% |
| Immigrants | Northern Africa | 98.1 /100 | #109 | Exceptional 5.3% |
Demographics Similar to Uruguayans by Disability Age 5 to 17
In terms of disability age 5 to 17, the demographic groups most similar to Uruguayans are Ukrainian (5.6%, a difference of 0.030%), Costa Rican (5.6%, a difference of 0.050%), Shoshone (5.6%, a difference of 0.080%), Immigrants from Central America (5.6%, a difference of 0.080%), and Serbian (5.6%, a difference of 0.15%).
| Demographics | Rating | Rank | Disability Age 5 to 17 |
| Greeks | 60.6 /100 | #166 | Good 5.6% |
| Immigrants | Burma/Myanmar | 59.3 /100 | #167 | Average 5.6% |
| Iraqis | 56.0 /100 | #168 | Average 5.6% |
| Immigrants | Norway | 55.7 /100 | #169 | Average 5.6% |
| Serbians | 54.0 /100 | #170 | Average 5.6% |
| Immigrants | Iraq | 53.9 /100 | #171 | Average 5.6% |
| Ukrainians | 51.5 /100 | #172 | Average 5.6% |
| Uruguayans | 51.0 /100 | #173 | Average 5.6% |
| Costa Ricans | 50.0 /100 | #174 | Average 5.6% |
| Shoshone | 49.4 /100 | #175 | Average 5.6% |
| Immigrants | Central America | 49.4 /100 | #176 | Average 5.6% |
| Immigrants | Western Europe | 47.8 /100 | #177 | Average 5.6% |
| Immigrants | Trinidad and Tobago | 47.6 /100 | #178 | Average 5.6% |
| Immigrants | Barbados | 40.5 /100 | #179 | Average 5.6% |
| Immigrants | Uruguay | 37.7 /100 | #180 | Fair 5.6% |