Lumbee vs Immigrants from Italy 11th Grade
COMPARE
Lumbee
Immigrants from Italy
11th Grade
11th Grade Comparison
Lumbee
Immigrants from Italy
88.9%
11TH GRADE
0.0/ 100
METRIC RATING
317th/ 347
METRIC RANK
92.9%
11TH GRADE
86.6/ 100
METRIC RATING
135th/ 347
METRIC RANK
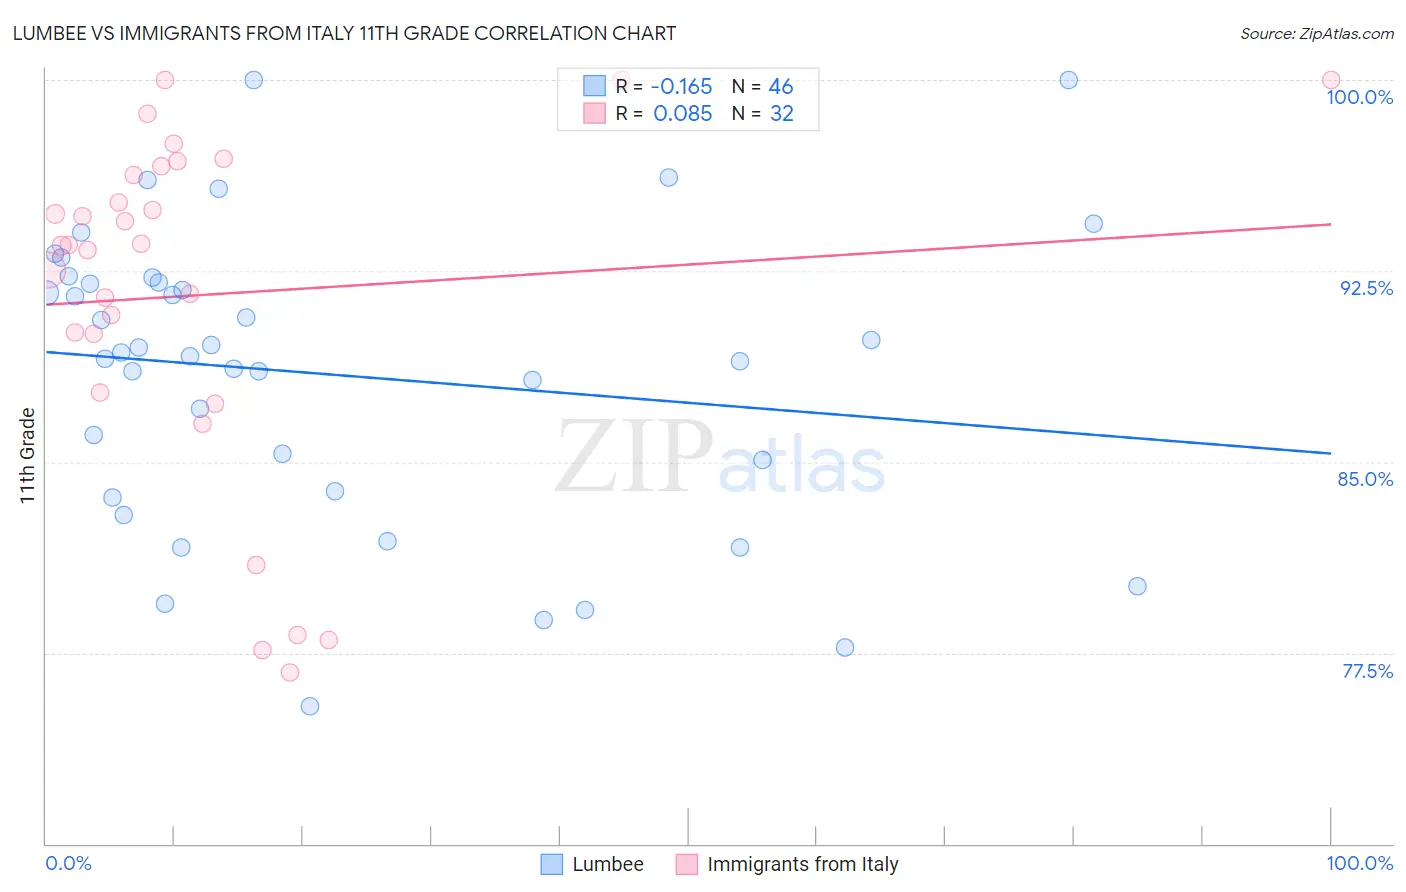
Lumbee vs Immigrants from Italy 11th Grade Correlation Chart
The statistical analysis conducted on geographies consisting of 92,299,068 people shows a poor negative correlation between the proportion of Lumbee and percentage of population with at least 11th grade education in the United States with a correlation coefficient (R) of -0.165 and weighted average of 88.9%. Similarly, the statistical analysis conducted on geographies consisting of 324,226,009 people shows a slight positive correlation between the proportion of Immigrants from Italy and percentage of population with at least 11th grade education in the United States with a correlation coefficient (R) of 0.085 and weighted average of 92.9%, a difference of 4.5%.
11th Grade Correlation Summary
| Measurement | Lumbee | Immigrants from Italy |
| Minimum | 75.4% | 76.7% |
| Maximum | 100.0% | 100.0% |
| Range | 24.6% | 23.3% |
| Mean | 88.4% | 91.6% |
| Median | 89.2% | 93.5% |
| Interquartile 25% (IQ1) | 83.9% | 88.9% |
| Interquartile 75% (IQ3) | 92.1% | 96.5% |
| Interquartile Range (IQR) | 8.2% | 7.6% |
| Standard Deviation (Sample) | 5.8% | 6.8% |
| Standard Deviation (Population) | 5.7% | 6.7% |
Similar Demographics by 11th Grade
Demographics Similar to Lumbee by 11th Grade
In terms of 11th grade, the demographic groups most similar to Lumbee are Immigrants from Cuba (88.9%, a difference of 0.010%), Nicaraguan (88.9%, a difference of 0.060%), Belizean (88.8%, a difference of 0.15%), Immigrants from Ecuador (89.1%, a difference of 0.16%), and Cape Verdean (89.1%, a difference of 0.17%).
| Demographics | Rating | Rank | 11th Grade |
| Yaqui | 0.0 /100 | #310 | Tragic 89.5% |
| Vietnamese | 0.0 /100 | #311 | Tragic 89.4% |
| Immigrants | Portugal | 0.0 /100 | #312 | Tragic 89.3% |
| Immigrants | Caribbean | 0.0 /100 | #313 | Tragic 89.1% |
| Cape Verdeans | 0.0 /100 | #314 | Tragic 89.1% |
| Immigrants | Ecuador | 0.0 /100 | #315 | Tragic 89.1% |
| Immigrants | Cuba | 0.0 /100 | #316 | Tragic 88.9% |
| Lumbee | 0.0 /100 | #317 | Tragic 88.9% |
| Nicaraguans | 0.0 /100 | #318 | Tragic 88.9% |
| Belizeans | 0.0 /100 | #319 | Tragic 88.8% |
| Immigrants | Armenia | 0.0 /100 | #320 | Tragic 88.8% |
| Immigrants | Belize | 0.0 /100 | #321 | Tragic 88.7% |
| Puerto Ricans | 0.0 /100 | #322 | Tragic 88.4% |
| Pima | 0.0 /100 | #323 | Tragic 88.3% |
| Central American Indians | 0.0 /100 | #324 | Tragic 88.2% |
Demographics Similar to Immigrants from Italy by 11th Grade
In terms of 11th grade, the demographic groups most similar to Immigrants from Italy are Cree (92.9%, a difference of 0.010%), Mongolian (93.0%, a difference of 0.020%), Delaware (93.0%, a difference of 0.020%), Arab (92.9%, a difference of 0.020%), and Immigrants from Brazil (92.9%, a difference of 0.030%).
| Demographics | Rating | Rank | 11th Grade |
| Immigrants | Jordan | 92.4 /100 | #128 | Exceptional 93.1% |
| Immigrants | Ukraine | 89.8 /100 | #129 | Excellent 93.0% |
| Albanians | 89.5 /100 | #130 | Excellent 93.0% |
| Egyptians | 89.5 /100 | #131 | Excellent 93.0% |
| Immigrants | Bosnia and Herzegovina | 89.0 /100 | #132 | Excellent 93.0% |
| Mongolians | 87.6 /100 | #133 | Excellent 93.0% |
| Delaware | 87.3 /100 | #134 | Excellent 93.0% |
| Immigrants | Italy | 86.6 /100 | #135 | Excellent 92.9% |
| Cree | 85.9 /100 | #136 | Excellent 92.9% |
| Arabs | 85.4 /100 | #137 | Excellent 92.9% |
| Immigrants | Brazil | 85.1 /100 | #138 | Excellent 92.9% |
| Crow | 84.1 /100 | #139 | Excellent 92.9% |
| Venezuelans | 83.4 /100 | #140 | Excellent 92.9% |
| Chileans | 83.0 /100 | #141 | Excellent 92.9% |
| Kenyans | 82.0 /100 | #142 | Excellent 92.9% |