Lumbee vs Immigrants from Italy Median Female Earnings
COMPARE
Lumbee
Immigrants from Italy
Median Female Earnings
Median Female Earnings Comparison
Lumbee
Immigrants from Italy
$32,500
MEDIAN FEMALE EARNINGS
0.0/ 100
METRIC RATING
344th/ 347
METRIC RANK
$42,446
MEDIAN FEMALE EARNINGS
99.7/ 100
METRIC RATING
76th/ 347
METRIC RANK
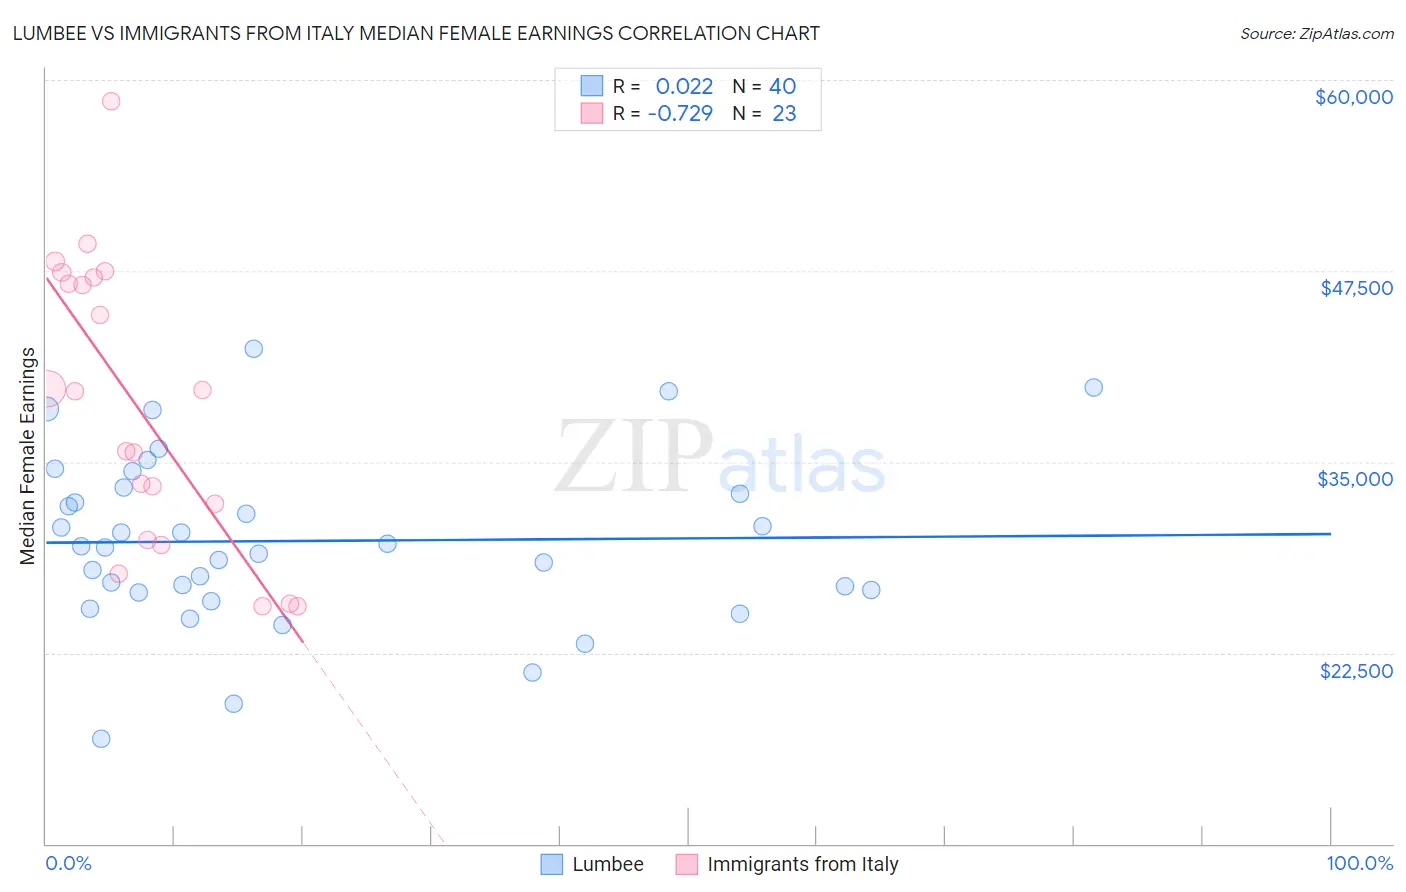
Lumbee vs Immigrants from Italy Median Female Earnings Correlation Chart
The statistical analysis conducted on geographies consisting of 92,259,660 people shows no correlation between the proportion of Lumbee and median female earnings in the United States with a correlation coefficient (R) of 0.022 and weighted average of $32,500. Similarly, the statistical analysis conducted on geographies consisting of 324,085,917 people shows a strong negative correlation between the proportion of Immigrants from Italy and median female earnings in the United States with a correlation coefficient (R) of -0.729 and weighted average of $42,446, a difference of 30.6%.
Median Female Earnings Correlation Summary
| Measurement | Lumbee | Immigrants from Italy |
| Minimum | $16,874 | $25,509 |
| Maximum | $42,434 | $58,594 |
| Range | $25,560 | $33,085 |
| Mean | $29,823 | $38,670 |
| Median | $29,442 | $39,639 |
| Interquartile 25% (IQ1) | $26,496 | $29,886 |
| Interquartile 75% (IQ3) | $33,125 | $47,033 |
| Interquartile Range (IQR) | $6,629 | $17,147 |
| Standard Deviation (Sample) | $5,605 | $9,280 |
| Standard Deviation (Population) | $5,534 | $9,076 |
Similar Demographics by Median Female Earnings
Demographics Similar to Lumbee by Median Female Earnings
In terms of median female earnings, the demographic groups most similar to Lumbee are Pueblo ($32,564, a difference of 0.20%), Yup'ik ($32,730, a difference of 0.71%), Navajo ($33,046, a difference of 1.7%), Tohono O'odham ($33,205, a difference of 2.2%), and Immigrants from Mexico ($33,236, a difference of 2.3%).
| Demographics | Rating | Rank | Median Female Earnings |
| Mexicans | 0.0 /100 | #333 | Tragic $33,664 |
| Spanish American Indians | 0.0 /100 | #334 | Tragic $33,625 |
| Creek | 0.0 /100 | #335 | Tragic $33,437 |
| Ottawa | 0.0 /100 | #336 | Tragic $33,378 |
| Yakama | 0.0 /100 | #337 | Tragic $33,354 |
| Immigrants | Cuba | 0.0 /100 | #338 | Tragic $33,291 |
| Immigrants | Mexico | 0.0 /100 | #339 | Tragic $33,236 |
| Tohono O'odham | 0.0 /100 | #340 | Tragic $33,205 |
| Navajo | 0.0 /100 | #341 | Tragic $33,046 |
| Yup'ik | 0.0 /100 | #342 | Tragic $32,730 |
| Pueblo | 0.0 /100 | #343 | Tragic $32,564 |
| Lumbee | 0.0 /100 | #344 | Tragic $32,500 |
| Puerto Ricans | 0.0 /100 | #345 | Tragic $31,560 |
| Arapaho | 0.0 /100 | #346 | Tragic $31,489 |
| Houma | 0.0 /100 | #347 | Tragic $30,343 |
Demographics Similar to Immigrants from Italy by Median Female Earnings
In terms of median female earnings, the demographic groups most similar to Immigrants from Italy are New Zealander ($42,446, a difference of 0.0%), Immigrants from Albania ($42,388, a difference of 0.14%), Immigrants from Kazakhstan ($42,386, a difference of 0.14%), Immigrants from South Africa ($42,508, a difference of 0.15%), and Mongolian ($42,542, a difference of 0.23%).
| Demographics | Rating | Rank | Median Female Earnings |
| Immigrants | Spain | 99.8 /100 | #69 | Exceptional $42,815 |
| Immigrants | Ethiopia | 99.8 /100 | #70 | Exceptional $42,744 |
| Immigrants | Romania | 99.8 /100 | #71 | Exceptional $42,718 |
| Albanians | 99.8 /100 | #72 | Exceptional $42,584 |
| Mongolians | 99.7 /100 | #73 | Exceptional $42,542 |
| Immigrants | South Africa | 99.7 /100 | #74 | Exceptional $42,508 |
| New Zealanders | 99.7 /100 | #75 | Exceptional $42,446 |
| Immigrants | Italy | 99.7 /100 | #76 | Exceptional $42,446 |
| Immigrants | Albania | 99.6 /100 | #77 | Exceptional $42,388 |
| Immigrants | Kazakhstan | 99.6 /100 | #78 | Exceptional $42,386 |
| Greeks | 99.6 /100 | #79 | Exceptional $42,336 |
| Immigrants | Moldova | 99.6 /100 | #80 | Exceptional $42,304 |
| Immigrants | Southern Europe | 99.5 /100 | #81 | Exceptional $42,275 |
| Immigrants | Morocco | 99.5 /100 | #82 | Exceptional $42,229 |
| Immigrants | Sierra Leone | 99.5 /100 | #83 | Exceptional $42,214 |