Lumbee vs Immigrants from Croatia Disability Age Under 5
COMPARE
Lumbee
Immigrants from Croatia
Disability Age Under 5
Disability Age Under 5 Comparison
Lumbee
Immigrants from Croatia
1.3%
DISABILITY AGE UNDER 5
2.1/ 100
METRIC RATING
242nd/ 347
METRIC RANK
1.3%
DISABILITY AGE UNDER 5
11.2/ 100
METRIC RATING
219th/ 347
METRIC RANK
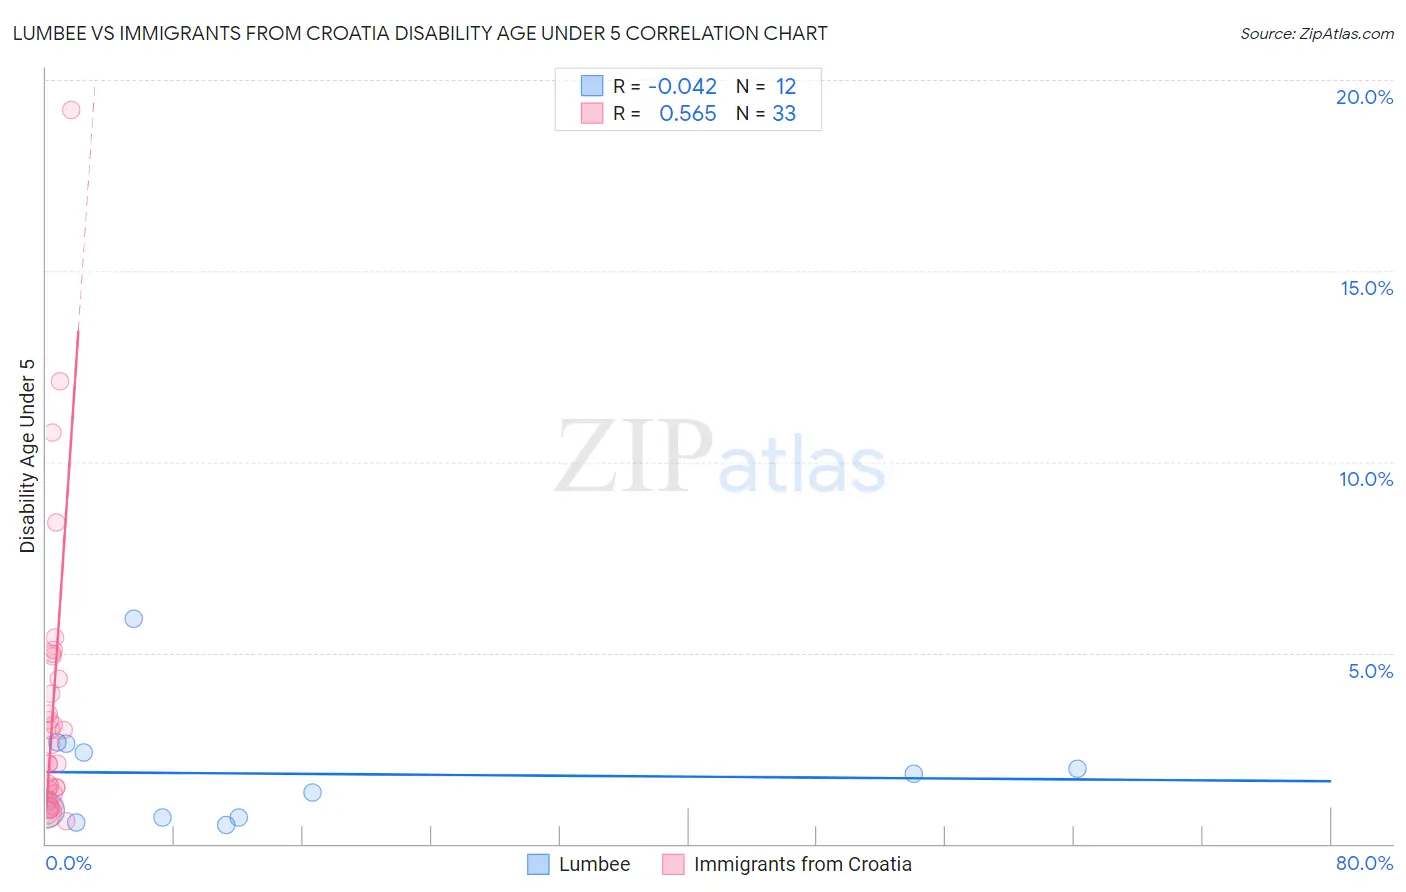
Lumbee vs Immigrants from Croatia Disability Age Under 5 Correlation Chart
The statistical analysis conducted on geographies consisting of 69,814,894 people shows no correlation between the proportion of Lumbee and percentage of population with a disability under the age of 5 in the United States with a correlation coefficient (R) of -0.042 and weighted average of 1.3%. Similarly, the statistical analysis conducted on geographies consisting of 91,296,638 people shows a substantial positive correlation between the proportion of Immigrants from Croatia and percentage of population with a disability under the age of 5 in the United States with a correlation coefficient (R) of 0.565 and weighted average of 1.3%, a difference of 3.8%.
Disability Age Under 5 Correlation Summary
| Measurement | Lumbee | Immigrants from Croatia |
| Minimum | 0.48% | 0.59% |
| Maximum | 5.9% | 19.2% |
| Range | 5.4% | 18.6% |
| Mean | 1.8% | 3.6% |
| Median | 1.6% | 2.1% |
| Interquartile 25% (IQ1) | 0.69% | 1.2% |
| Interquartile 75% (IQ3) | 2.5% | 4.6% |
| Interquartile Range (IQR) | 1.8% | 3.4% |
| Standard Deviation (Sample) | 1.5% | 3.9% |
| Standard Deviation (Population) | 1.4% | 3.9% |
Similar Demographics by Disability Age Under 5
Demographics Similar to Lumbee by Disability Age Under 5
In terms of disability age under 5, the demographic groups most similar to Lumbee are Maltese (1.3%, a difference of 0.080%), Native Hawaiian (1.3%, a difference of 0.15%), Immigrants from Austria (1.3%, a difference of 0.18%), Spanish American Indian (1.3%, a difference of 0.34%), and Immigrants from Cameroon (1.4%, a difference of 0.38%).
| Demographics | Rating | Rank | Disability Age Under 5 |
| Central American Indians | 3.6 /100 | #235 | Tragic 1.3% |
| South American Indians | 3.3 /100 | #236 | Tragic 1.3% |
| Basques | 3.0 /100 | #237 | Tragic 1.3% |
| Spanish American Indians | 2.4 /100 | #238 | Tragic 1.3% |
| Immigrants | Austria | 2.3 /100 | #239 | Tragic 1.3% |
| Native Hawaiians | 2.2 /100 | #240 | Tragic 1.3% |
| Maltese | 2.2 /100 | #241 | Tragic 1.3% |
| Lumbee | 2.1 /100 | #242 | Tragic 1.3% |
| Immigrants | Cameroon | 1.7 /100 | #243 | Tragic 1.4% |
| Spaniards | 1.4 /100 | #244 | Tragic 1.4% |
| Potawatomi | 1.1 /100 | #245 | Tragic 1.4% |
| Russians | 1.0 /100 | #246 | Tragic 1.4% |
| Immigrants | England | 1.0 /100 | #247 | Tragic 1.4% |
| Eastern Europeans | 1.0 /100 | #248 | Tragic 1.4% |
| Bermudans | 1.0 /100 | #249 | Tragic 1.4% |
Demographics Similar to Immigrants from Croatia by Disability Age Under 5
In terms of disability age under 5, the demographic groups most similar to Immigrants from Croatia are Serbian (1.3%, a difference of 0.37%), Malaysian (1.3%, a difference of 0.40%), Subsaharan African (1.3%, a difference of 0.71%), Ukrainian (1.3%, a difference of 0.71%), and Cypriot (1.3%, a difference of 0.72%).
| Demographics | Rating | Rank | Disability Age Under 5 |
| Chileans | 18.8 /100 | #212 | Poor 1.3% |
| Immigrants | Sudan | 18.7 /100 | #213 | Poor 1.3% |
| Immigrants | Chile | 17.2 /100 | #214 | Poor 1.3% |
| Syrians | 16.1 /100 | #215 | Poor 1.3% |
| Bangladeshis | 15.5 /100 | #216 | Poor 1.3% |
| Cypriots | 14.9 /100 | #217 | Poor 1.3% |
| Malaysians | 13.2 /100 | #218 | Poor 1.3% |
| Immigrants | Croatia | 11.2 /100 | #219 | Poor 1.3% |
| Serbians | 9.6 /100 | #220 | Tragic 1.3% |
| Sub-Saharan Africans | 8.3 /100 | #221 | Tragic 1.3% |
| Ukrainians | 8.3 /100 | #222 | Tragic 1.3% |
| Hispanics or Latinos | 7.7 /100 | #223 | Tragic 1.3% |
| Latvians | 7.1 /100 | #224 | Tragic 1.3% |
| Panamanians | 7.1 /100 | #225 | Tragic 1.3% |
| Bahamians | 7.1 /100 | #226 | Tragic 1.3% |