U.S. Virgin Islander vs Immigrants from Croatia Disability Age Under 5
COMPARE
U.S. Virgin Islander
Immigrants from Croatia
Disability Age Under 5
Disability Age Under 5 Comparison
U.S. Virgin Islanders
Immigrants from Croatia
1.3%
DISABILITY AGE UNDER 5
34.4/ 100
METRIC RATING
195th/ 347
METRIC RANK
1.3%
DISABILITY AGE UNDER 5
11.2/ 100
METRIC RATING
219th/ 347
METRIC RANK
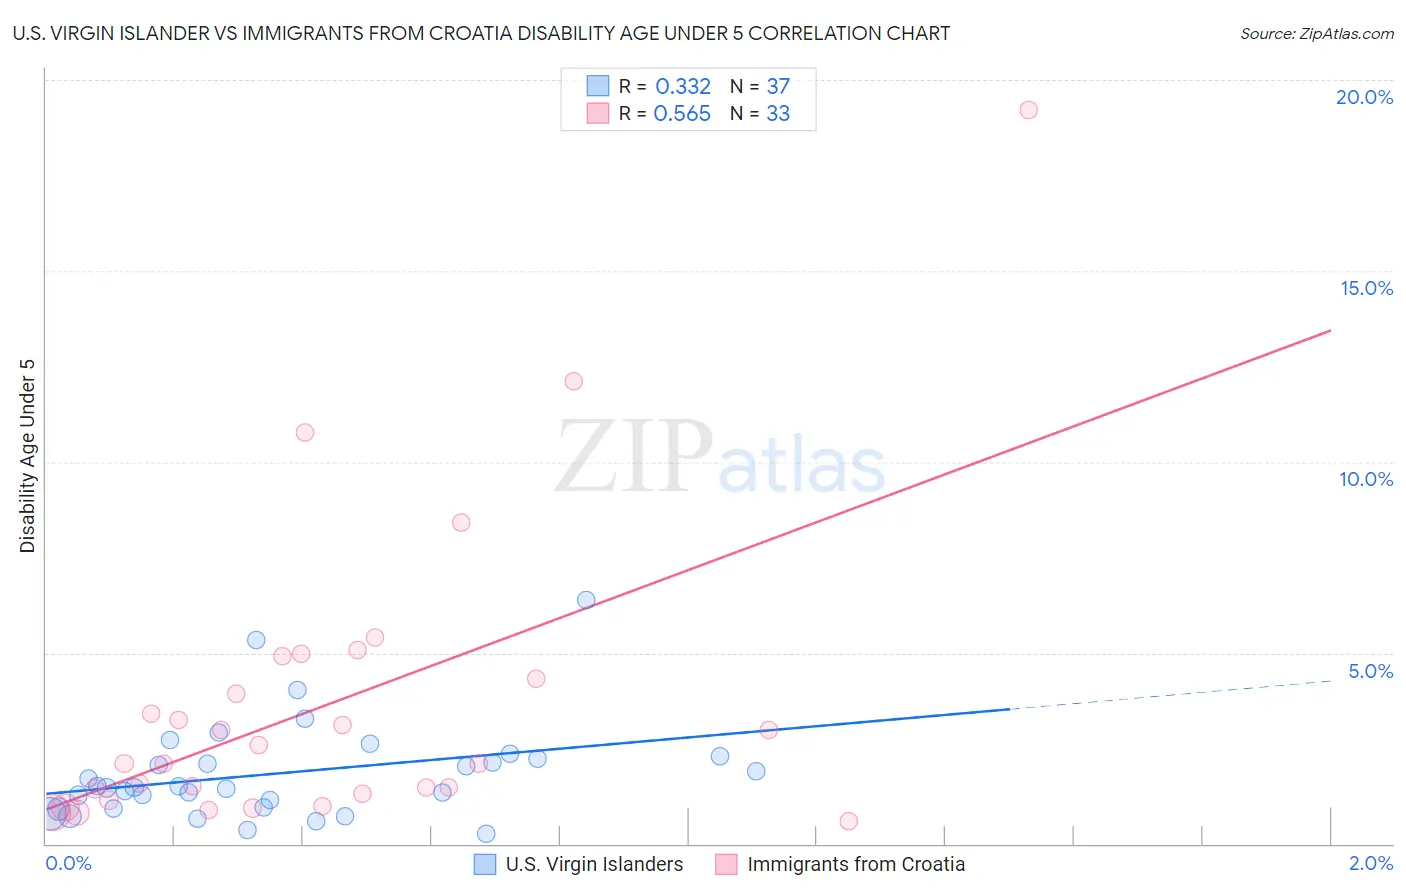
U.S. Virgin Islander vs Immigrants from Croatia Disability Age Under 5 Correlation Chart
The statistical analysis conducted on geographies consisting of 67,886,708 people shows a mild positive correlation between the proportion of U.S. Virgin Islanders and percentage of population with a disability under the age of 5 in the United States with a correlation coefficient (R) of 0.332 and weighted average of 1.3%. Similarly, the statistical analysis conducted on geographies consisting of 91,296,638 people shows a substantial positive correlation between the proportion of Immigrants from Croatia and percentage of population with a disability under the age of 5 in the United States with a correlation coefficient (R) of 0.565 and weighted average of 1.3%, a difference of 3.2%.
Disability Age Under 5 Correlation Summary
| Measurement | U.S. Virgin Islander | Immigrants from Croatia |
| Minimum | 0.26% | 0.59% |
| Maximum | 6.4% | 19.2% |
| Range | 6.1% | 18.6% |
| Mean | 1.8% | 3.6% |
| Median | 1.5% | 2.1% |
| Interquartile 25% (IQ1) | 0.94% | 1.2% |
| Interquartile 75% (IQ3) | 2.3% | 4.6% |
| Interquartile Range (IQR) | 1.3% | 3.4% |
| Standard Deviation (Sample) | 1.3% | 3.9% |
| Standard Deviation (Population) | 1.3% | 3.9% |
Similar Demographics by Disability Age Under 5
Demographics Similar to U.S. Virgin Islanders by Disability Age Under 5
In terms of disability age under 5, the demographic groups most similar to U.S. Virgin Islanders are Immigrants from North Macedonia (1.3%, a difference of 0.020%), Immigrants from Sierra Leone (1.3%, a difference of 0.20%), Mexican American Indian (1.3%, a difference of 0.21%), Immigrants from Bosnia and Herzegovina (1.3%, a difference of 0.21%), and Immigrants from Laos (1.3%, a difference of 0.22%).
| Demographics | Rating | Rank | Disability Age Under 5 |
| Haitians | 39.9 /100 | #188 | Fair 1.3% |
| Peruvians | 37.6 /100 | #189 | Fair 1.3% |
| Immigrants | Laos | 36.6 /100 | #190 | Fair 1.3% |
| Mexican American Indians | 36.6 /100 | #191 | Fair 1.3% |
| Immigrants | Bosnia and Herzegovina | 36.5 /100 | #192 | Fair 1.3% |
| Immigrants | Sierra Leone | 36.5 /100 | #193 | Fair 1.3% |
| Immigrants | North Macedonia | 34.7 /100 | #194 | Fair 1.3% |
| U.S. Virgin Islanders | 34.4 /100 | #195 | Fair 1.3% |
| Immigrants | Belgium | 31.4 /100 | #196 | Fair 1.3% |
| Immigrants | Somalia | 31.3 /100 | #197 | Fair 1.3% |
| Immigrants | Norway | 31.1 /100 | #198 | Fair 1.3% |
| Jamaicans | 30.7 /100 | #199 | Fair 1.3% |
| Immigrants | Lithuania | 27.2 /100 | #200 | Fair 1.3% |
| Immigrants | Italy | 25.4 /100 | #201 | Fair 1.3% |
| Arapaho | 24.1 /100 | #202 | Fair 1.3% |
Demographics Similar to Immigrants from Croatia by Disability Age Under 5
In terms of disability age under 5, the demographic groups most similar to Immigrants from Croatia are Serbian (1.3%, a difference of 0.37%), Malaysian (1.3%, a difference of 0.40%), Subsaharan African (1.3%, a difference of 0.71%), Ukrainian (1.3%, a difference of 0.71%), and Cypriot (1.3%, a difference of 0.72%).
| Demographics | Rating | Rank | Disability Age Under 5 |
| Chileans | 18.8 /100 | #212 | Poor 1.3% |
| Immigrants | Sudan | 18.7 /100 | #213 | Poor 1.3% |
| Immigrants | Chile | 17.2 /100 | #214 | Poor 1.3% |
| Syrians | 16.1 /100 | #215 | Poor 1.3% |
| Bangladeshis | 15.5 /100 | #216 | Poor 1.3% |
| Cypriots | 14.9 /100 | #217 | Poor 1.3% |
| Malaysians | 13.2 /100 | #218 | Poor 1.3% |
| Immigrants | Croatia | 11.2 /100 | #219 | Poor 1.3% |
| Serbians | 9.6 /100 | #220 | Tragic 1.3% |
| Sub-Saharan Africans | 8.3 /100 | #221 | Tragic 1.3% |
| Ukrainians | 8.3 /100 | #222 | Tragic 1.3% |
| Hispanics or Latinos | 7.7 /100 | #223 | Tragic 1.3% |
| Latvians | 7.1 /100 | #224 | Tragic 1.3% |
| Panamanians | 7.1 /100 | #225 | Tragic 1.3% |
| Bahamians | 7.1 /100 | #226 | Tragic 1.3% |