Lumbee vs Indian (Asian) Disability Age Under 5
COMPARE
Lumbee
Indian (Asian)
Disability Age Under 5
Disability Age Under 5 Comparison
Lumbee
Indians (Asian)
1.3%
DISABILITY AGE UNDER 5
2.1/ 100
METRIC RATING
242nd/ 347
METRIC RANK
1.0%
DISABILITY AGE UNDER 5
100.0/ 100
METRIC RATING
24th/ 347
METRIC RANK
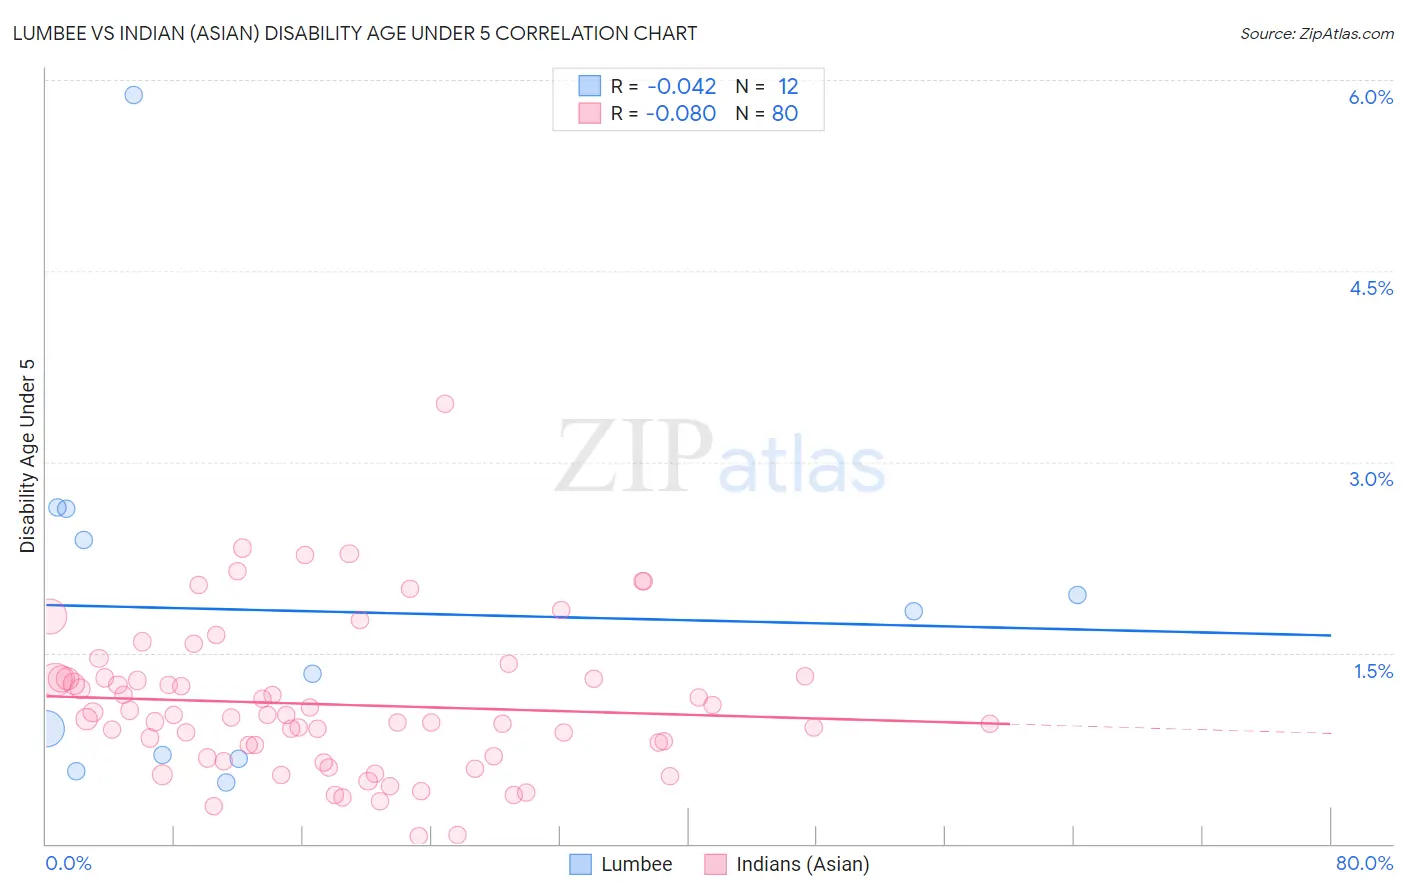
Lumbee vs Indian (Asian) Disability Age Under 5 Correlation Chart
The statistical analysis conducted on geographies consisting of 69,814,894 people shows no correlation between the proportion of Lumbee and percentage of population with a disability under the age of 5 in the United States with a correlation coefficient (R) of -0.042 and weighted average of 1.3%. Similarly, the statistical analysis conducted on geographies consisting of 247,409,982 people shows a slight negative correlation between the proportion of Indians (Asian) and percentage of population with a disability under the age of 5 in the United States with a correlation coefficient (R) of -0.080 and weighted average of 1.0%, a difference of 34.5%.
Disability Age Under 5 Correlation Summary
| Measurement | Lumbee | Indian (Asian) |
| Minimum | 0.48% | 0.058% |
| Maximum | 5.9% | 3.5% |
| Range | 5.4% | 3.4% |
| Mean | 1.8% | 1.1% |
| Median | 1.6% | 1.0% |
| Interquartile 25% (IQ1) | 0.69% | 0.68% |
| Interquartile 75% (IQ3) | 2.5% | 1.3% |
| Interquartile Range (IQR) | 1.8% | 0.62% |
| Standard Deviation (Sample) | 1.5% | 0.59% |
| Standard Deviation (Population) | 1.4% | 0.59% |
Similar Demographics by Disability Age Under 5
Demographics Similar to Lumbee by Disability Age Under 5
In terms of disability age under 5, the demographic groups most similar to Lumbee are Maltese (1.3%, a difference of 0.080%), Native Hawaiian (1.3%, a difference of 0.15%), Immigrants from Austria (1.3%, a difference of 0.18%), Spanish American Indian (1.3%, a difference of 0.34%), and Immigrants from Cameroon (1.4%, a difference of 0.38%).
| Demographics | Rating | Rank | Disability Age Under 5 |
| Central American Indians | 3.6 /100 | #235 | Tragic 1.3% |
| South American Indians | 3.3 /100 | #236 | Tragic 1.3% |
| Basques | 3.0 /100 | #237 | Tragic 1.3% |
| Spanish American Indians | 2.4 /100 | #238 | Tragic 1.3% |
| Immigrants | Austria | 2.3 /100 | #239 | Tragic 1.3% |
| Native Hawaiians | 2.2 /100 | #240 | Tragic 1.3% |
| Maltese | 2.2 /100 | #241 | Tragic 1.3% |
| Lumbee | 2.1 /100 | #242 | Tragic 1.3% |
| Immigrants | Cameroon | 1.7 /100 | #243 | Tragic 1.4% |
| Spaniards | 1.4 /100 | #244 | Tragic 1.4% |
| Potawatomi | 1.1 /100 | #245 | Tragic 1.4% |
| Russians | 1.0 /100 | #246 | Tragic 1.4% |
| Immigrants | England | 1.0 /100 | #247 | Tragic 1.4% |
| Eastern Europeans | 1.0 /100 | #248 | Tragic 1.4% |
| Bermudans | 1.0 /100 | #249 | Tragic 1.4% |
Demographics Similar to Indians (Asian) by Disability Age Under 5
In terms of disability age under 5, the demographic groups most similar to Indians (Asian) are Yakama (1.00%, a difference of 0.28%), Immigrants from Micronesia (1.0%, a difference of 0.31%), Immigrants from Iran (1.00%, a difference of 0.36%), Immigrants from Taiwan (1.0%, a difference of 0.43%), and British West Indian (0.99%, a difference of 1.1%).
| Demographics | Rating | Rank | Disability Age Under 5 |
| Immigrants | China | 100.0 /100 | #17 | Exceptional 0.96% |
| Immigrants | Barbados | 100.0 /100 | #18 | Exceptional 0.97% |
| Puget Sound Salish | 100.0 /100 | #19 | Exceptional 0.97% |
| Nepalese | 100.0 /100 | #20 | Exceptional 0.97% |
| British West Indians | 100.0 /100 | #21 | Exceptional 0.99% |
| Immigrants | Iran | 100.0 /100 | #22 | Exceptional 1.00% |
| Yakama | 100.0 /100 | #23 | Exceptional 1.00% |
| Indians (Asian) | 100.0 /100 | #24 | Exceptional 1.0% |
| Immigrants | Micronesia | 100.0 /100 | #25 | Exceptional 1.0% |
| Immigrants | Taiwan | 100.0 /100 | #26 | Exceptional 1.0% |
| Guyanese | 100.0 /100 | #27 | Exceptional 1.0% |
| Immigrants | Eastern Asia | 100.0 /100 | #28 | Exceptional 1.0% |
| Immigrants | Belarus | 100.0 /100 | #29 | Exceptional 1.0% |
| Immigrants | South Central Asia | 99.9 /100 | #30 | Exceptional 1.0% |
| Armenians | 99.9 /100 | #31 | Exceptional 1.0% |