Lumbee vs Guamanian/Chamorro Disability Age Under 5
COMPARE
Lumbee
Guamanian/Chamorro
Disability Age Under 5
Disability Age Under 5 Comparison
Lumbee
Guamanians/Chamorros
1.3%
DISABILITY AGE UNDER 5
2.1/ 100
METRIC RATING
242nd/ 347
METRIC RANK
1.2%
DISABILITY AGE UNDER 5
57.8/ 100
METRIC RATING
171st/ 347
METRIC RANK
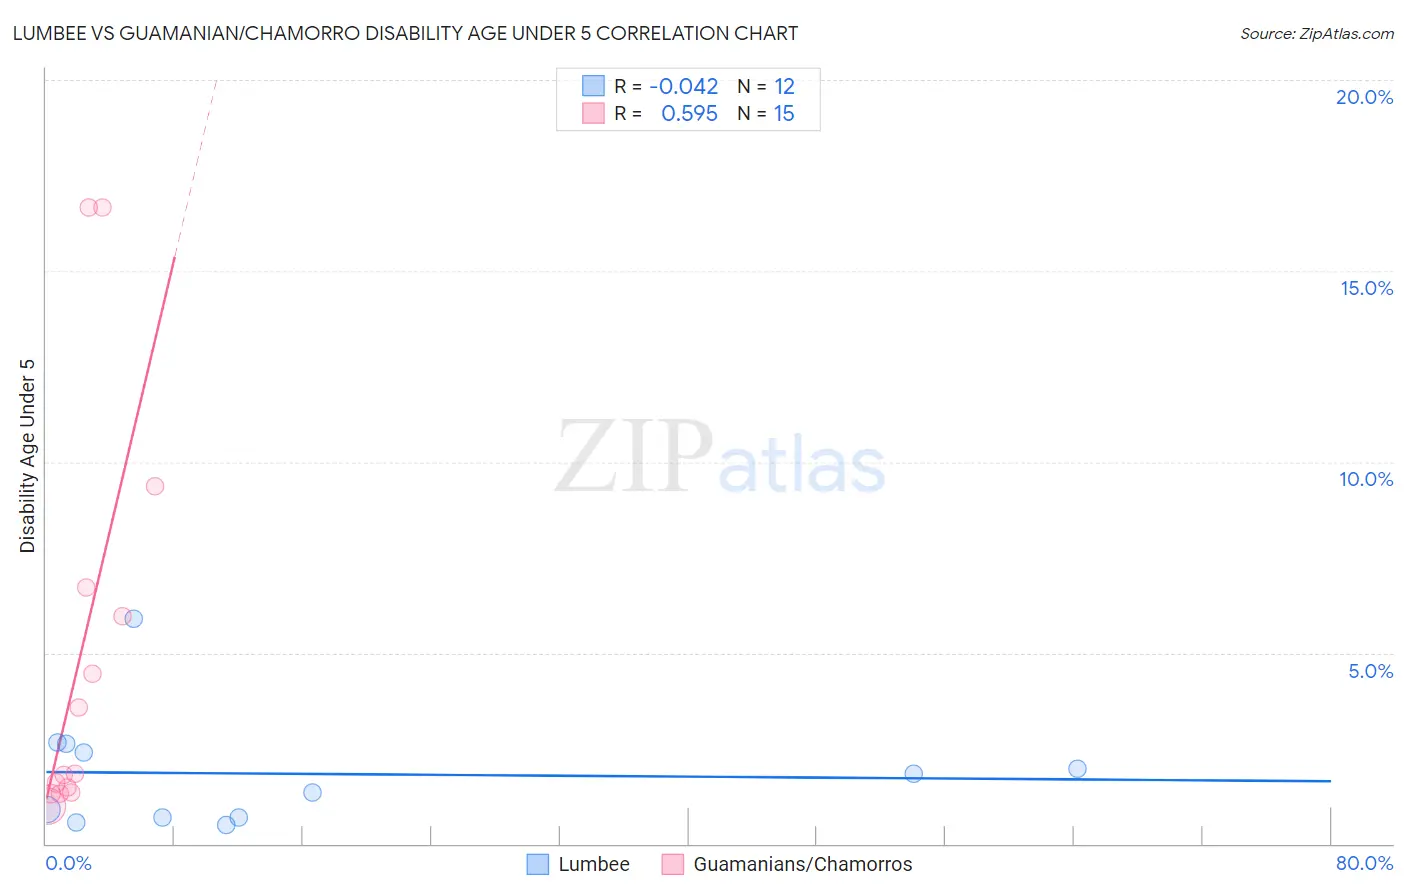
Lumbee vs Guamanian/Chamorro Disability Age Under 5 Correlation Chart
The statistical analysis conducted on geographies consisting of 69,814,894 people shows no correlation between the proportion of Lumbee and percentage of population with a disability under the age of 5 in the United States with a correlation coefficient (R) of -0.042 and weighted average of 1.3%. Similarly, the statistical analysis conducted on geographies consisting of 149,028,768 people shows a substantial positive correlation between the proportion of Guamanians/Chamorros and percentage of population with a disability under the age of 5 in the United States with a correlation coefficient (R) of 0.595 and weighted average of 1.2%, a difference of 9.5%.
Disability Age Under 5 Correlation Summary
| Measurement | Lumbee | Guamanian/Chamorro |
| Minimum | 0.48% | 0.97% |
| Maximum | 5.9% | 16.7% |
| Range | 5.4% | 15.7% |
| Mean | 1.8% | 5.0% |
| Median | 1.6% | 1.8% |
| Interquartile 25% (IQ1) | 0.69% | 1.4% |
| Interquartile 75% (IQ3) | 2.5% | 6.7% |
| Interquartile Range (IQR) | 1.8% | 5.3% |
| Standard Deviation (Sample) | 1.5% | 5.3% |
| Standard Deviation (Population) | 1.4% | 5.2% |
Similar Demographics by Disability Age Under 5
Demographics Similar to Lumbee by Disability Age Under 5
In terms of disability age under 5, the demographic groups most similar to Lumbee are Maltese (1.3%, a difference of 0.080%), Native Hawaiian (1.3%, a difference of 0.15%), Immigrants from Austria (1.3%, a difference of 0.18%), Spanish American Indian (1.3%, a difference of 0.34%), and Immigrants from Cameroon (1.4%, a difference of 0.38%).
| Demographics | Rating | Rank | Disability Age Under 5 |
| Central American Indians | 3.6 /100 | #235 | Tragic 1.3% |
| South American Indians | 3.3 /100 | #236 | Tragic 1.3% |
| Basques | 3.0 /100 | #237 | Tragic 1.3% |
| Spanish American Indians | 2.4 /100 | #238 | Tragic 1.3% |
| Immigrants | Austria | 2.3 /100 | #239 | Tragic 1.3% |
| Native Hawaiians | 2.2 /100 | #240 | Tragic 1.3% |
| Maltese | 2.2 /100 | #241 | Tragic 1.3% |
| Lumbee | 2.1 /100 | #242 | Tragic 1.3% |
| Immigrants | Cameroon | 1.7 /100 | #243 | Tragic 1.4% |
| Spaniards | 1.4 /100 | #244 | Tragic 1.4% |
| Potawatomi | 1.1 /100 | #245 | Tragic 1.4% |
| Russians | 1.0 /100 | #246 | Tragic 1.4% |
| Immigrants | England | 1.0 /100 | #247 | Tragic 1.4% |
| Eastern Europeans | 1.0 /100 | #248 | Tragic 1.4% |
| Bermudans | 1.0 /100 | #249 | Tragic 1.4% |
Demographics Similar to Guamanians/Chamorros by Disability Age Under 5
In terms of disability age under 5, the demographic groups most similar to Guamanians/Chamorros are Immigrants from Jamaica (1.2%, a difference of 0.090%), Immigrants from Uruguay (1.2%, a difference of 0.11%), Sierra Leonean (1.2%, a difference of 0.12%), Immigrants from Argentina (1.2%, a difference of 0.23%), and Immigrants from Central America (1.2%, a difference of 0.34%).
| Demographics | Rating | Rank | Disability Age Under 5 |
| Laotians | 62.8 /100 | #164 | Good 1.2% |
| Immigrants | Kuwait | 62.6 /100 | #165 | Good 1.2% |
| Immigrants | Central America | 61.4 /100 | #166 | Good 1.2% |
| Immigrants | Argentina | 60.2 /100 | #167 | Good 1.2% |
| Sierra Leoneans | 59.1 /100 | #168 | Average 1.2% |
| Immigrants | Uruguay | 59.0 /100 | #169 | Average 1.2% |
| Immigrants | Jamaica | 58.8 /100 | #170 | Average 1.2% |
| Guamanians/Chamorros | 57.8 /100 | #171 | Average 1.2% |
| Crow | 51.0 /100 | #172 | Average 1.2% |
| Immigrants | Ireland | 50.3 /100 | #173 | Average 1.2% |
| Immigrants | Latvia | 50.0 /100 | #174 | Average 1.2% |
| Immigrants | Nigeria | 50.0 /100 | #175 | Average 1.2% |
| Immigrants | Kenya | 48.6 /100 | #176 | Average 1.2% |
| Comanche | 47.5 /100 | #177 | Average 1.2% |
| Venezuelans | 47.1 /100 | #178 | Average 1.2% |