Lumbee vs Slovak Disability Age Under 5
COMPARE
Lumbee
Slovak
Disability Age Under 5
Disability Age Under 5 Comparison
Lumbee
Slovaks
1.3%
DISABILITY AGE UNDER 5
2.1/ 100
METRIC RATING
242nd/ 347
METRIC RANK
1.7%
DISABILITY AGE UNDER 5
0.0/ 100
METRIC RATING
319th/ 347
METRIC RANK
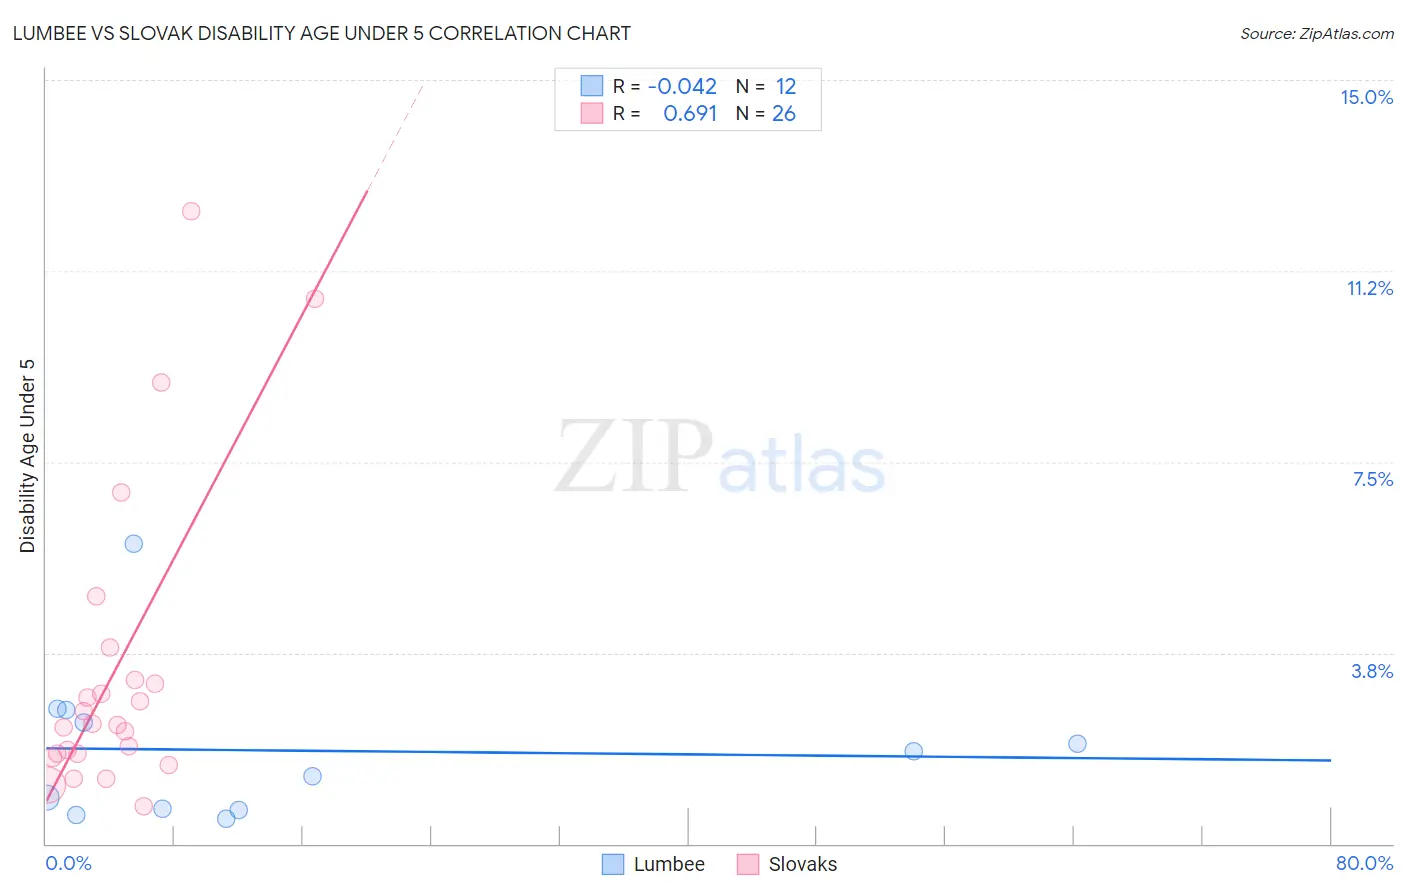
Lumbee vs Slovak Disability Age Under 5 Correlation Chart
The statistical analysis conducted on geographies consisting of 69,814,894 people shows no correlation between the proportion of Lumbee and percentage of population with a disability under the age of 5 in the United States with a correlation coefficient (R) of -0.042 and weighted average of 1.3%. Similarly, the statistical analysis conducted on geographies consisting of 205,574,578 people shows a significant positive correlation between the proportion of Slovaks and percentage of population with a disability under the age of 5 in the United States with a correlation coefficient (R) of 0.691 and weighted average of 1.7%, a difference of 26.2%.
Disability Age Under 5 Correlation Summary
| Measurement | Lumbee | Slovak |
| Minimum | 0.48% | 0.73% |
| Maximum | 5.9% | 12.4% |
| Range | 5.4% | 11.7% |
| Mean | 1.8% | 3.4% |
| Median | 1.6% | 2.3% |
| Interquartile 25% (IQ1) | 0.69% | 1.8% |
| Interquartile 75% (IQ3) | 2.5% | 3.2% |
| Interquartile Range (IQR) | 1.8% | 1.4% |
| Standard Deviation (Sample) | 1.5% | 3.0% |
| Standard Deviation (Population) | 1.4% | 2.9% |
Similar Demographics by Disability Age Under 5
Demographics Similar to Lumbee by Disability Age Under 5
In terms of disability age under 5, the demographic groups most similar to Lumbee are Maltese (1.3%, a difference of 0.080%), Native Hawaiian (1.3%, a difference of 0.15%), Immigrants from Austria (1.3%, a difference of 0.18%), Spanish American Indian (1.3%, a difference of 0.34%), and Immigrants from Cameroon (1.4%, a difference of 0.38%).
| Demographics | Rating | Rank | Disability Age Under 5 |
| Central American Indians | 3.6 /100 | #235 | Tragic 1.3% |
| South American Indians | 3.3 /100 | #236 | Tragic 1.3% |
| Basques | 3.0 /100 | #237 | Tragic 1.3% |
| Spanish American Indians | 2.4 /100 | #238 | Tragic 1.3% |
| Immigrants | Austria | 2.3 /100 | #239 | Tragic 1.3% |
| Native Hawaiians | 2.2 /100 | #240 | Tragic 1.3% |
| Maltese | 2.2 /100 | #241 | Tragic 1.3% |
| Lumbee | 2.1 /100 | #242 | Tragic 1.3% |
| Immigrants | Cameroon | 1.7 /100 | #243 | Tragic 1.4% |
| Spaniards | 1.4 /100 | #244 | Tragic 1.4% |
| Potawatomi | 1.1 /100 | #245 | Tragic 1.4% |
| Russians | 1.0 /100 | #246 | Tragic 1.4% |
| Immigrants | England | 1.0 /100 | #247 | Tragic 1.4% |
| Eastern Europeans | 1.0 /100 | #248 | Tragic 1.4% |
| Bermudans | 1.0 /100 | #249 | Tragic 1.4% |
Demographics Similar to Slovaks by Disability Age Under 5
In terms of disability age under 5, the demographic groups most similar to Slovaks are Irish (1.7%, a difference of 0.31%), Scotch-Irish (1.7%, a difference of 0.53%), French (1.7%, a difference of 0.58%), Ottawa (1.7%, a difference of 0.59%), and Immigrants from Cabo Verde (1.7%, a difference of 1.0%).
| Demographics | Rating | Rank | Disability Age Under 5 |
| Puerto Ricans | 0.0 /100 | #312 | Tragic 1.7% |
| Celtics | 0.0 /100 | #313 | Tragic 1.7% |
| Norwegians | 0.0 /100 | #314 | Tragic 1.7% |
| Dutch | 0.0 /100 | #315 | Tragic 1.7% |
| Immigrants | Cabo Verde | 0.0 /100 | #316 | Tragic 1.7% |
| French | 0.0 /100 | #317 | Tragic 1.7% |
| Irish | 0.0 /100 | #318 | Tragic 1.7% |
| Slovaks | 0.0 /100 | #319 | Tragic 1.7% |
| Scotch-Irish | 0.0 /100 | #320 | Tragic 1.7% |
| Ottawa | 0.0 /100 | #321 | Tragic 1.7% |
| Germans | 0.0 /100 | #322 | Tragic 1.7% |
| Chickasaw | 0.0 /100 | #323 | Tragic 1.7% |
| Cherokee | 0.0 /100 | #324 | Tragic 1.8% |
| Immigrants | Portugal | 0.0 /100 | #325 | Tragic 1.8% |
| Sioux | 0.0 /100 | #326 | Tragic 1.8% |