Lumbee vs Immigrants from Poland Disability Age Under 5
COMPARE
Lumbee
Immigrants from Poland
Disability Age Under 5
Disability Age Under 5 Comparison
Lumbee
Immigrants from Poland
1.3%
DISABILITY AGE UNDER 5
2.1/ 100
METRIC RATING
242nd/ 347
METRIC RANK
1.3%
DISABILITY AGE UNDER 5
22.4/ 100
METRIC RATING
206th/ 347
METRIC RANK
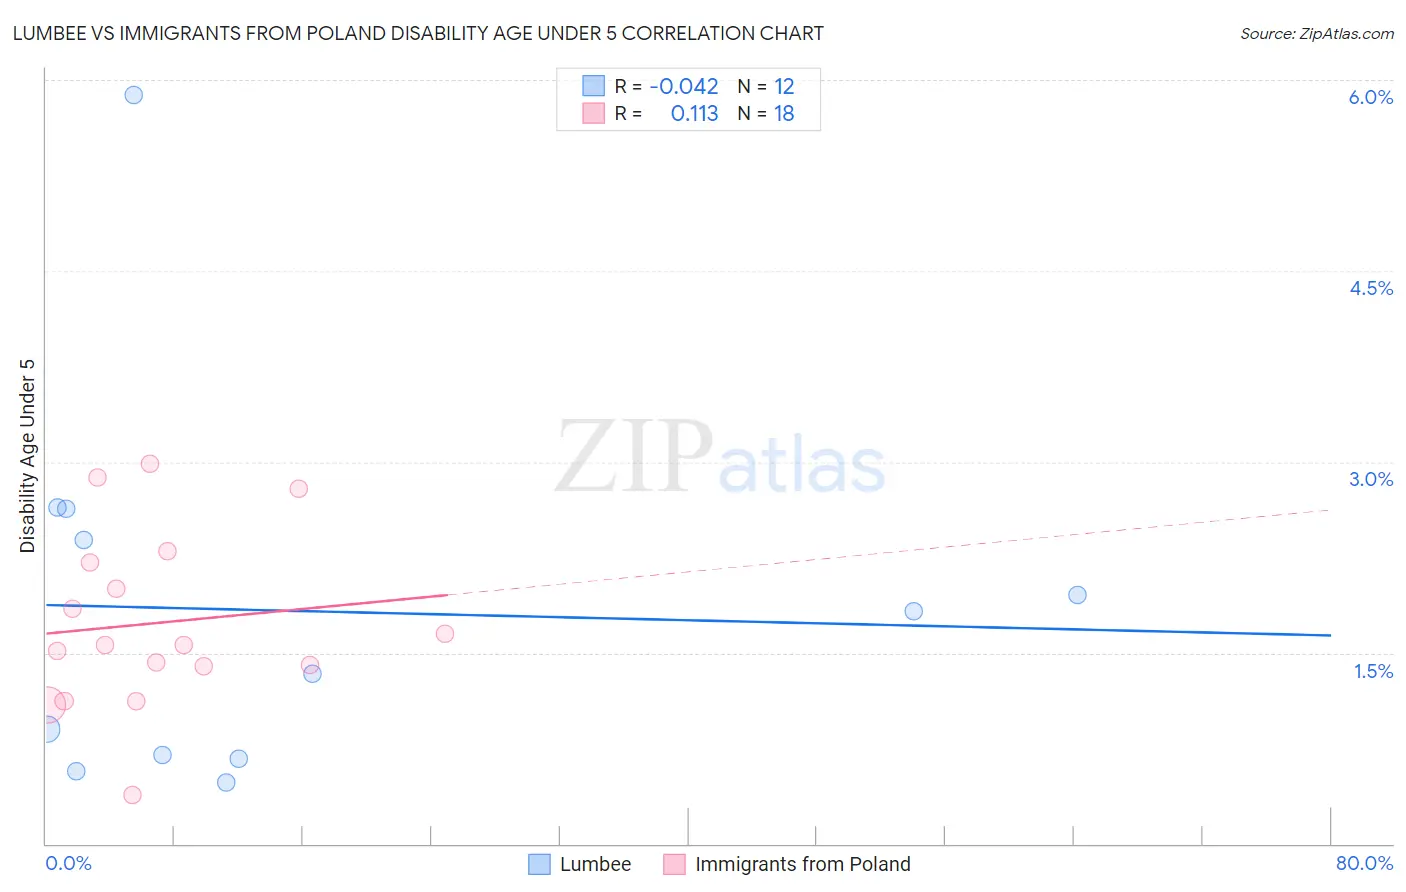
Lumbee vs Immigrants from Poland Disability Age Under 5 Correlation Chart
The statistical analysis conducted on geographies consisting of 69,814,894 people shows no correlation between the proportion of Lumbee and percentage of population with a disability under the age of 5 in the United States with a correlation coefficient (R) of -0.042 and weighted average of 1.3%. Similarly, the statistical analysis conducted on geographies consisting of 173,203,351 people shows a poor positive correlation between the proportion of Immigrants from Poland and percentage of population with a disability under the age of 5 in the United States with a correlation coefficient (R) of 0.113 and weighted average of 1.3%, a difference of 5.7%.
Disability Age Under 5 Correlation Summary
| Measurement | Lumbee | Immigrants from Poland |
| Minimum | 0.48% | 0.38% |
| Maximum | 5.9% | 3.0% |
| Range | 5.4% | 2.6% |
| Mean | 1.8% | 1.7% |
| Median | 1.6% | 1.6% |
| Interquartile 25% (IQ1) | 0.69% | 1.4% |
| Interquartile 75% (IQ3) | 2.5% | 2.2% |
| Interquartile Range (IQR) | 1.8% | 0.82% |
| Standard Deviation (Sample) | 1.5% | 0.69% |
| Standard Deviation (Population) | 1.4% | 0.67% |
Similar Demographics by Disability Age Under 5
Demographics Similar to Lumbee by Disability Age Under 5
In terms of disability age under 5, the demographic groups most similar to Lumbee are Maltese (1.3%, a difference of 0.080%), Native Hawaiian (1.3%, a difference of 0.15%), Immigrants from Austria (1.3%, a difference of 0.18%), Spanish American Indian (1.3%, a difference of 0.34%), and Immigrants from Cameroon (1.4%, a difference of 0.38%).
| Demographics | Rating | Rank | Disability Age Under 5 |
| Central American Indians | 3.6 /100 | #235 | Tragic 1.3% |
| South American Indians | 3.3 /100 | #236 | Tragic 1.3% |
| Basques | 3.0 /100 | #237 | Tragic 1.3% |
| Spanish American Indians | 2.4 /100 | #238 | Tragic 1.3% |
| Immigrants | Austria | 2.3 /100 | #239 | Tragic 1.3% |
| Native Hawaiians | 2.2 /100 | #240 | Tragic 1.3% |
| Maltese | 2.2 /100 | #241 | Tragic 1.3% |
| Lumbee | 2.1 /100 | #242 | Tragic 1.3% |
| Immigrants | Cameroon | 1.7 /100 | #243 | Tragic 1.4% |
| Spaniards | 1.4 /100 | #244 | Tragic 1.4% |
| Potawatomi | 1.1 /100 | #245 | Tragic 1.4% |
| Russians | 1.0 /100 | #246 | Tragic 1.4% |
| Immigrants | England | 1.0 /100 | #247 | Tragic 1.4% |
| Eastern Europeans | 1.0 /100 | #248 | Tragic 1.4% |
| Bermudans | 1.0 /100 | #249 | Tragic 1.4% |
Demographics Similar to Immigrants from Poland by Disability Age Under 5
In terms of disability age under 5, the demographic groups most similar to Immigrants from Poland are Romanian (1.3%, a difference of 0.020%), Nigerian (1.3%, a difference of 0.15%), Immigrants from Europe (1.3%, a difference of 0.16%), Liberian (1.3%, a difference of 0.20%), and Mexican (1.3%, a difference of 0.21%).
| Demographics | Rating | Rank | Disability Age Under 5 |
| Jamaicans | 30.7 /100 | #199 | Fair 1.3% |
| Immigrants | Lithuania | 27.2 /100 | #200 | Fair 1.3% |
| Immigrants | Italy | 25.4 /100 | #201 | Fair 1.3% |
| Arapaho | 24.1 /100 | #202 | Fair 1.3% |
| Liberians | 24.0 /100 | #203 | Fair 1.3% |
| Immigrants | Europe | 23.6 /100 | #204 | Fair 1.3% |
| Romanians | 22.5 /100 | #205 | Fair 1.3% |
| Immigrants | Poland | 22.4 /100 | #206 | Fair 1.3% |
| Nigerians | 21.2 /100 | #207 | Fair 1.3% |
| Mexicans | 20.8 /100 | #208 | Fair 1.3% |
| Bulgarians | 19.5 /100 | #209 | Poor 1.3% |
| Pakistanis | 19.4 /100 | #210 | Poor 1.3% |
| Immigrants | Greece | 19.1 /100 | #211 | Poor 1.3% |
| Chileans | 18.8 /100 | #212 | Poor 1.3% |
| Immigrants | Sudan | 18.7 /100 | #213 | Poor 1.3% |